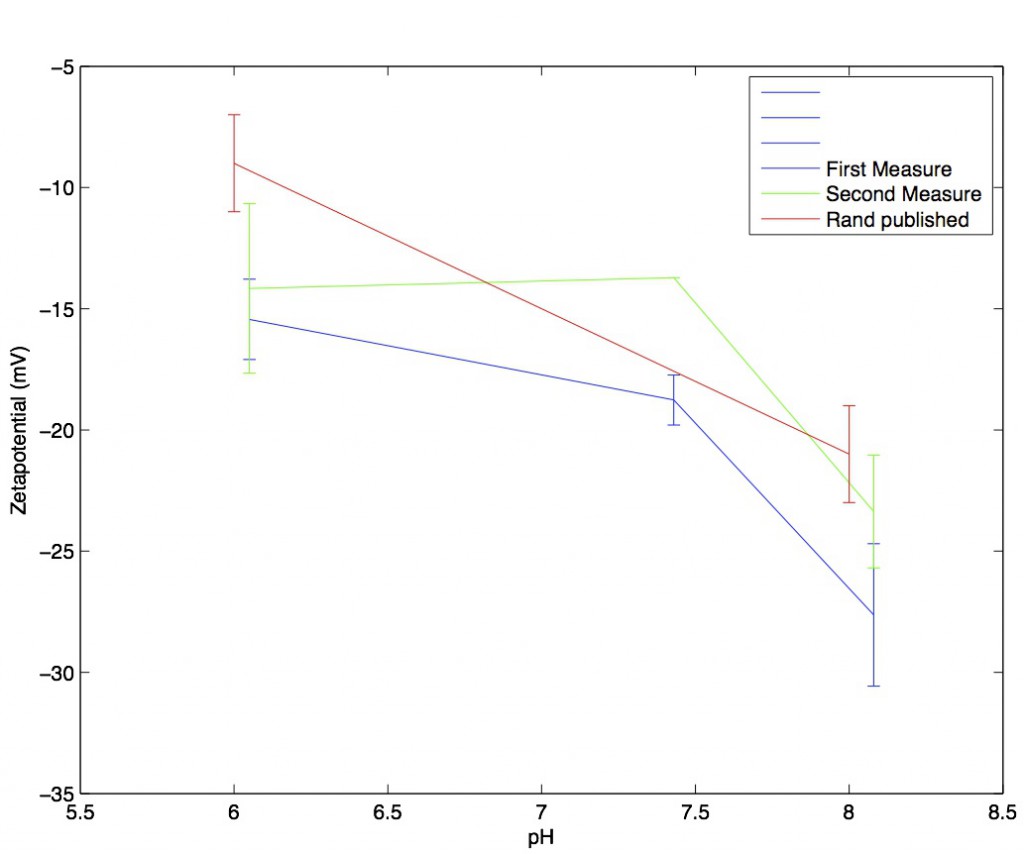
A pH vs. Zetapotential graph for SiN membranes
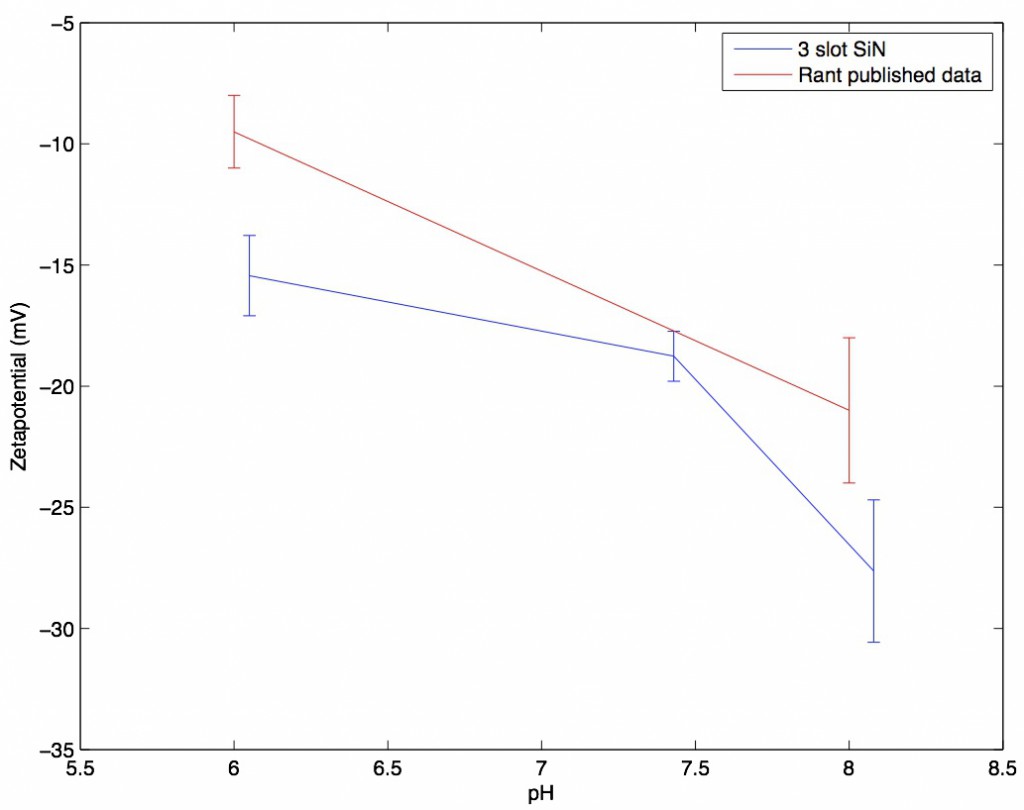
The blue line reflects measurements taken with my zetapotential setup. Each data point is the average of three independent measurements of zetapotential (a new 3-slot SiN wafer 1024 chip for each measurement) and the linear fit for the pressure vs. streaming potential was at least R^2 > 0.92. Error bars come from the standard deviation of the three measurements. Two data points at pH 6 with R^2 less than .9 were excluded (they are shown below). The red line comes from the Ulrich Rant paper (SiN paper) and similarly was derived as the average across three chips (although the error bars may be the standard error and not the standard deviation). Their chips were SiN with a single nanopore drilled into them via TEM, and they use 400mM KCl with no buffer as their solution. The full figure that I pulled the red line from is below:

Note that they did not include their raw data, so the red line represents my best attempt at eyeballing.
My raw data is available in the following excel spreadsheet (6:9:14 pH sweep).
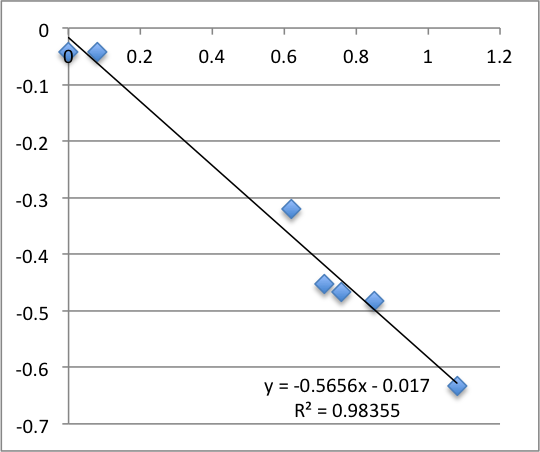
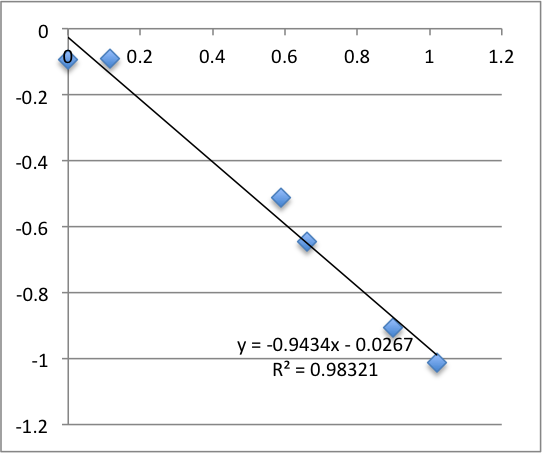
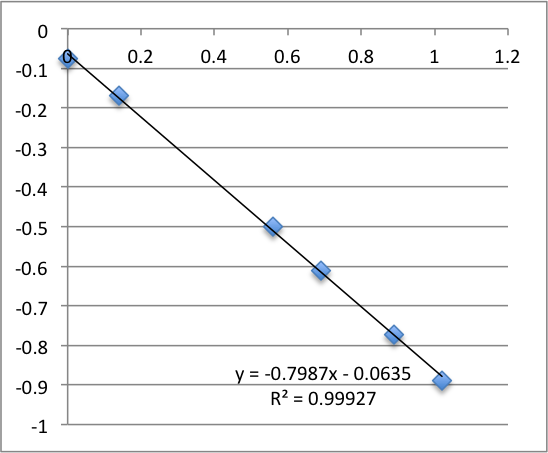
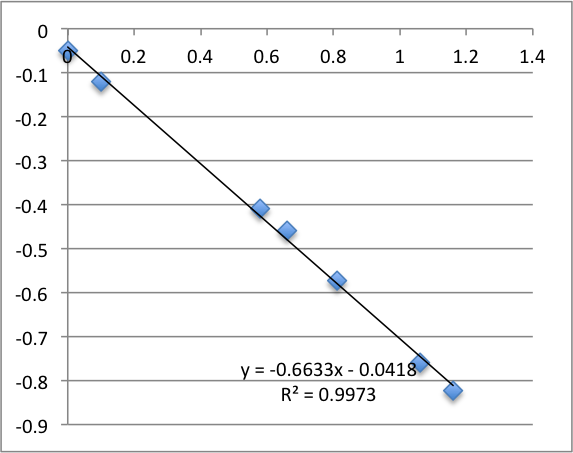
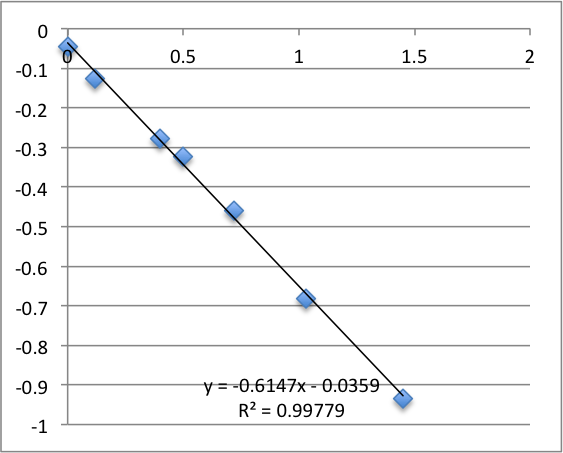
I’ll post the graphs of the first measurement on each chip for the three different pH values I used. First is pH 7.43:

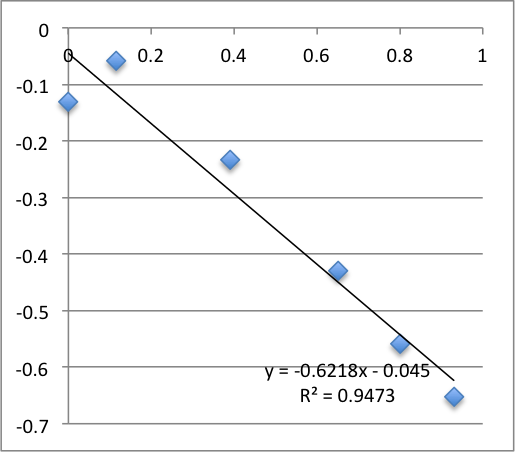
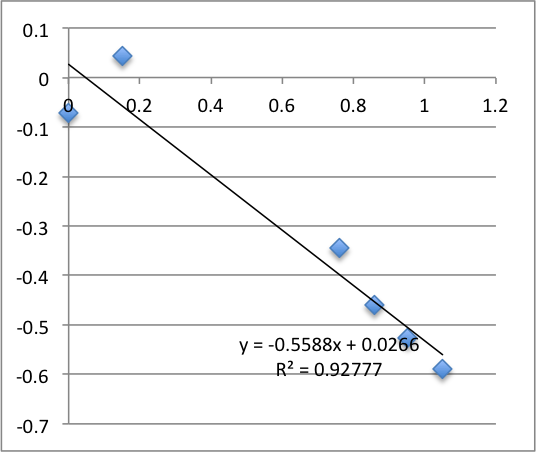
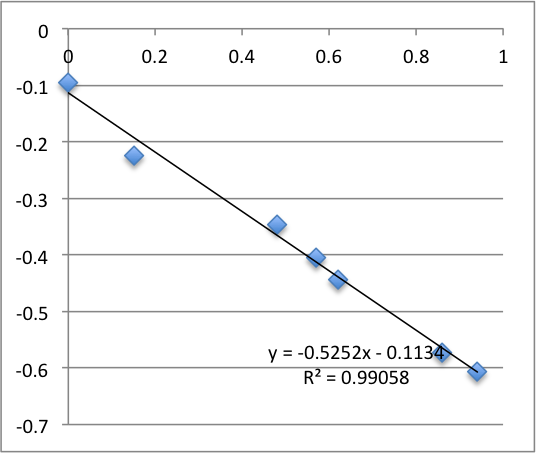
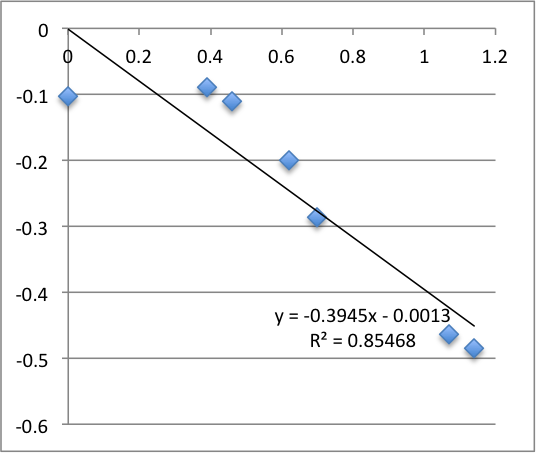
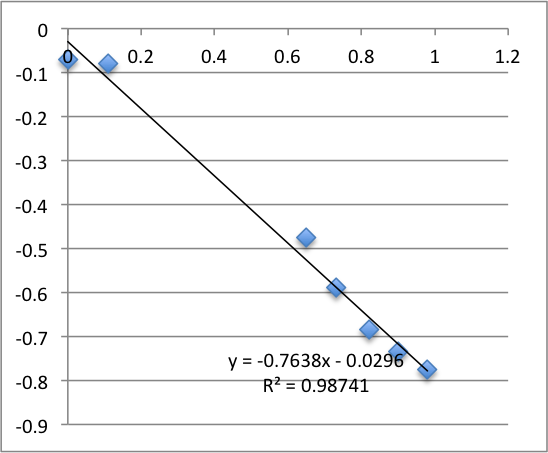
Note that all of these graphs are in the form pressure (x-axis) v. streaming potential (y-axis). The slope is multiplied by a conductivity-dependent factor according to the helmholtz-smolachowski relationship – the factor is typically around 35.
Next is pH 6.08:
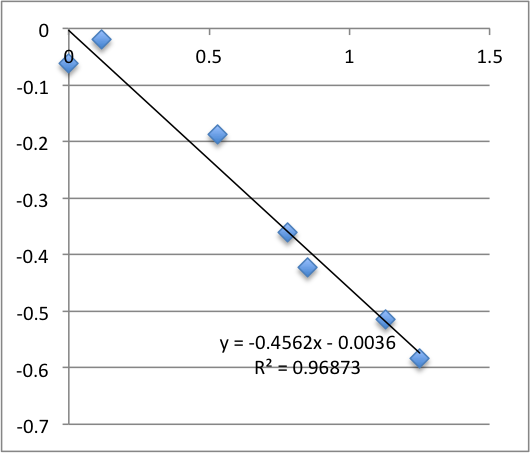
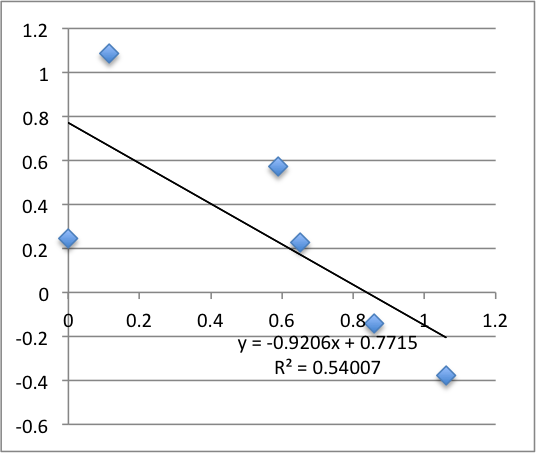
Remember that each of these graphs is a first measurement on a new chip. The final two pH 6.08 graphs pictured were excluded from the final data.
Finally is pH 8:
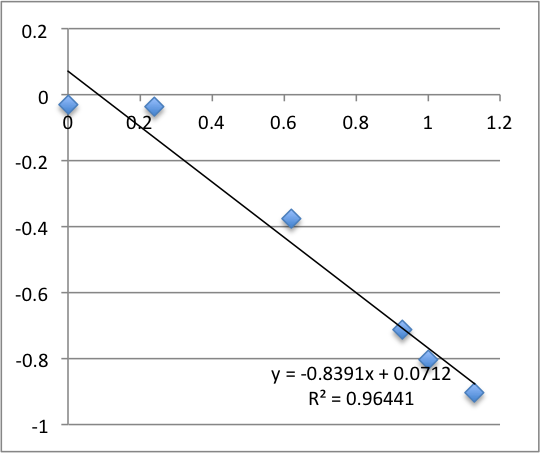
Typically, a lot of the error is coming from the first two data points – the data ‘settles down’ after that point. Previously I’d explained this as the inherent slow drift in the DC bias of the electrodes, but this time I was careful to try to account for this when I took this data set. For all of these measurements I found that the DC bias was very stable before the measurement (drifting at a rate not greater than 0.01 mV/min) and after the measurement, so it seems unlikely that we’re actually seeing DC drift. Instead, my new hypothesis is that when I allow the electrodes to equilibrate for five minutes after putting a chip in, they are reaching a chemical equilibrium with the small chambers of salt solution, and that as soon as any amount of fluid is flushed through the chamber they reach a more stable equilibrium with the actual, non-depleted electrolyte. Consider the measurements at pH 8. I’ll re-post them here, and follow each chip’s first measurement with it’s second measurement, taken five minutes after the first, and then the third measurement taken five minutes after that. There seems to be something unique about that first measurement.
Chip 1. Measurements 1 and 2 (no third measurement was taken):
Chip 2. Measurements 1, 2, and 3:
Chip 3. Measurements 1, 2, and 3:


The general trend – increasing R^2 values, decreasing zetapotentials in successive measurements – holds across all the chips I measured for this post. I’ve plotted the average and standard dev of both the first and second measurements below:
****
The Rant paper goes on to cite this paper (old SiN paper) which has this figure:

Rant et. al. explain the difference between their data and the old SiN paper’s data by claiming that their salt solution (400 mM KCl) is stronger than the older paper’s (10 mM NaCl, with a small amount of buffer), and that theory predicts a lower zeta as a result. Our buffer was 10 mM KCl with 1 mM phosphate buffer.