HUVEC Spreading on Different SiO2 Membranes
Overview:
This experiment was conducted to determine the difference in human umbilical vein endothelial cell (HUVEC) spreading on different membranes. The cells were grown on the membranes for a specified length of time and then stained and imaged to determine the amount of spread on the membranes. This study was a continuation of HUVEC Spreading on Various Microporous SiO2 Membranes, where HUVEC cells were seen pushing through pores of the 3HP membranes. Enough data was collected during those experiments to be further used for this study.
Methods:
The membranes used in the experiment included: 0.5um low porosity, 0.5um high porosity, 3um low porosity, 3um high porosity, and non-porous, tissue culture plastic was also used as a control. Three sets of these surfaces were made, each set was given a time point, these time points were 1hr, 4hr, and 24hr. Each of the membranes was made in the CytoVu style and placed in the bottom of a 24-well plate. After being assembled, the plates were exposed to UV light for one hour. Each of the surfaces was coated with 1% GelTrex in PBS and left for 30 minutes, the solution was then removed and allowed to dry. The cells were seeded at 500 cells/well. At one hour, all of the wells were flooded with standard HUVEC proliferation media. At this time point, the first set of surfaces which included every membrane type and tcp, was fixed using 3.7% paraformaldahyde for 15 minutes. DAPI/Phallodin (actin/nuclei) stain was added to all of the wells in the first set and each of the surfaces was imaged. Each of the membranes were imaged in 10x in each of its four corners so the entire membrane could be considered. The process of fixing, staining, and imaging the cells was done to the second set of surfaces at the four hour time point and then done to the third set of surfaces at the twenty-four hour time point.
Once all of the images were collected, they were processed to determine the amount of cell spreading, this was done using ImageJ. A single corner of one membrane was first uploaded to ImageJ, the image file contained three .tif images which were: phase contrast, DAPI (nuclei), and phallodin (actin). Using the phallodin image, ImageJ was used to adjust the threshold and then convert the image to binary. This created a black and white image, the white being the cells and the black being the background. Although this was done manually when looking at the phallodin image, it also corrected the DAPI image. The DAPI image was used in conjunction with the phallodin image to determine if the cells could be measured. A cell would be determined measurable if there was a single nuclei within the white cell, it the nuclei did not appear to be going through division, and if there was a nucleus associated with the white spot believed to be a cell. Once a cell was determined to be measurable, the area of the cell was found using the measuring tool which would output the pixel area of each cell. The area of each cell within the membrane was found and then placed into an Excel sheet. Once within the Excel sheet, the areas were organized from greatest to least. The bottom 25% of the data was removed as these were believed to be small cells, dead cells, or possibly debris that would not accurately represent the average area of the cells. Using the top 75% of the data, the average for each surface type at each time point was found. The averages were converted from pixels to microns and a graph was created using the averages. A bar graph was also created using the averages for each membrane at the 24hr time point. Graphs can be seen below in data.
Images below show the steps taken to process the images:
Phase Contrast Image (1hr, 10x, TCP)
DAPI Image (1hr, 10x, TCP)
Phallodin Image with Adjusted Threshold (1hr, 10x, TCP)
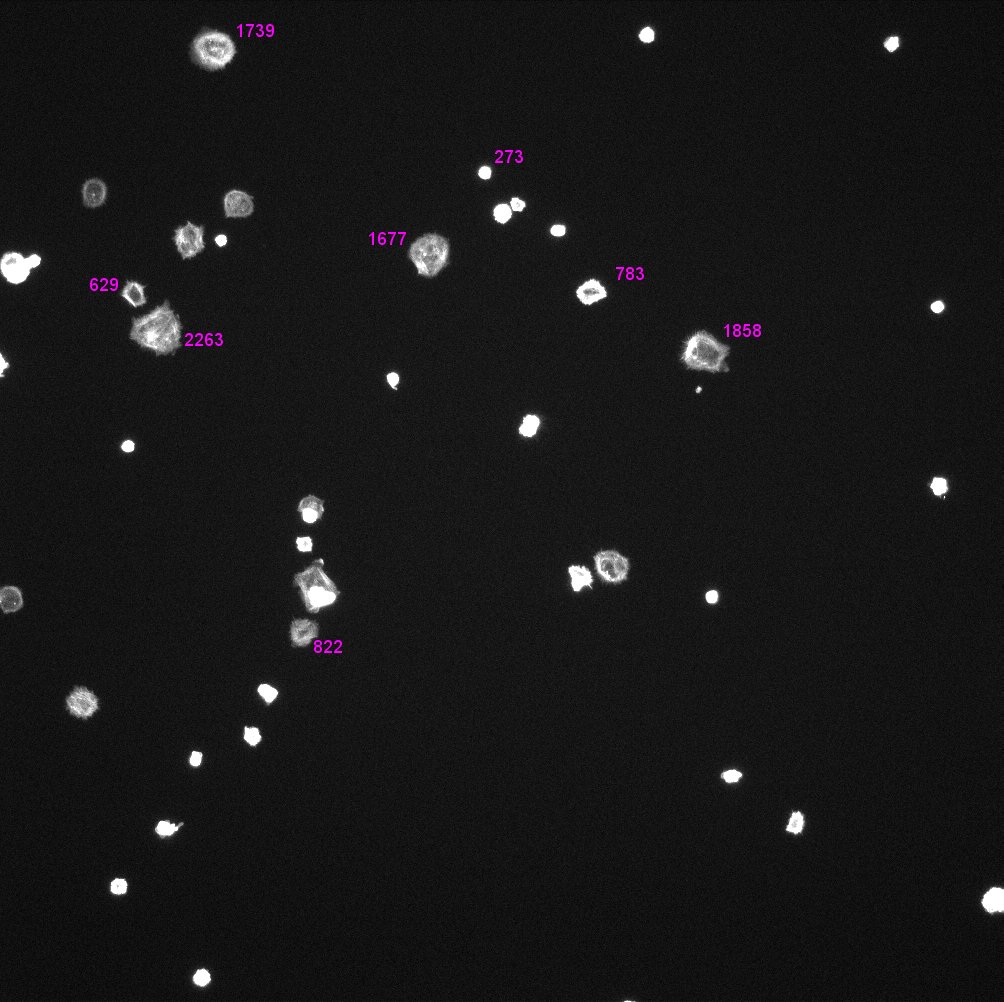
Phallodin Image with Labeled Areas (without Threshold, TCP, 1hr, 10x)
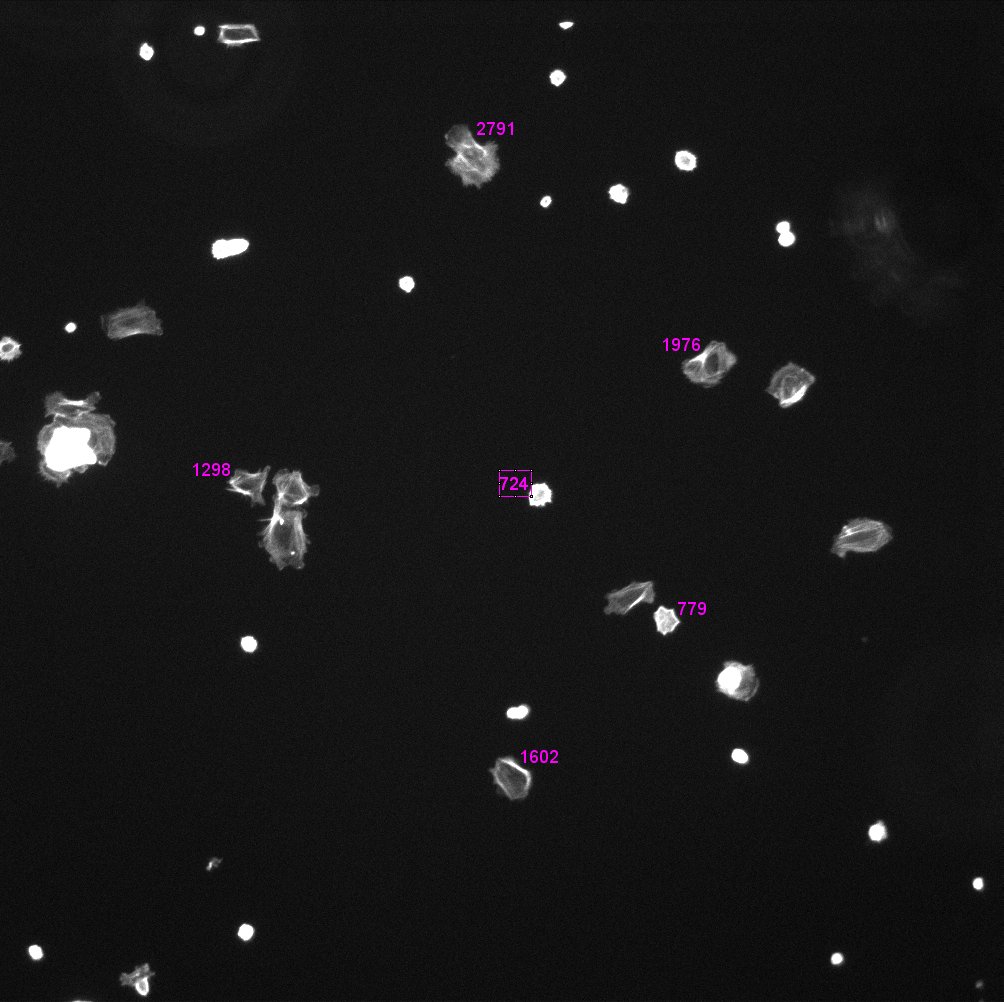
Phallodin Image with Labeled Areas (without Threshold, Non-Porous, 4hr, 10x)
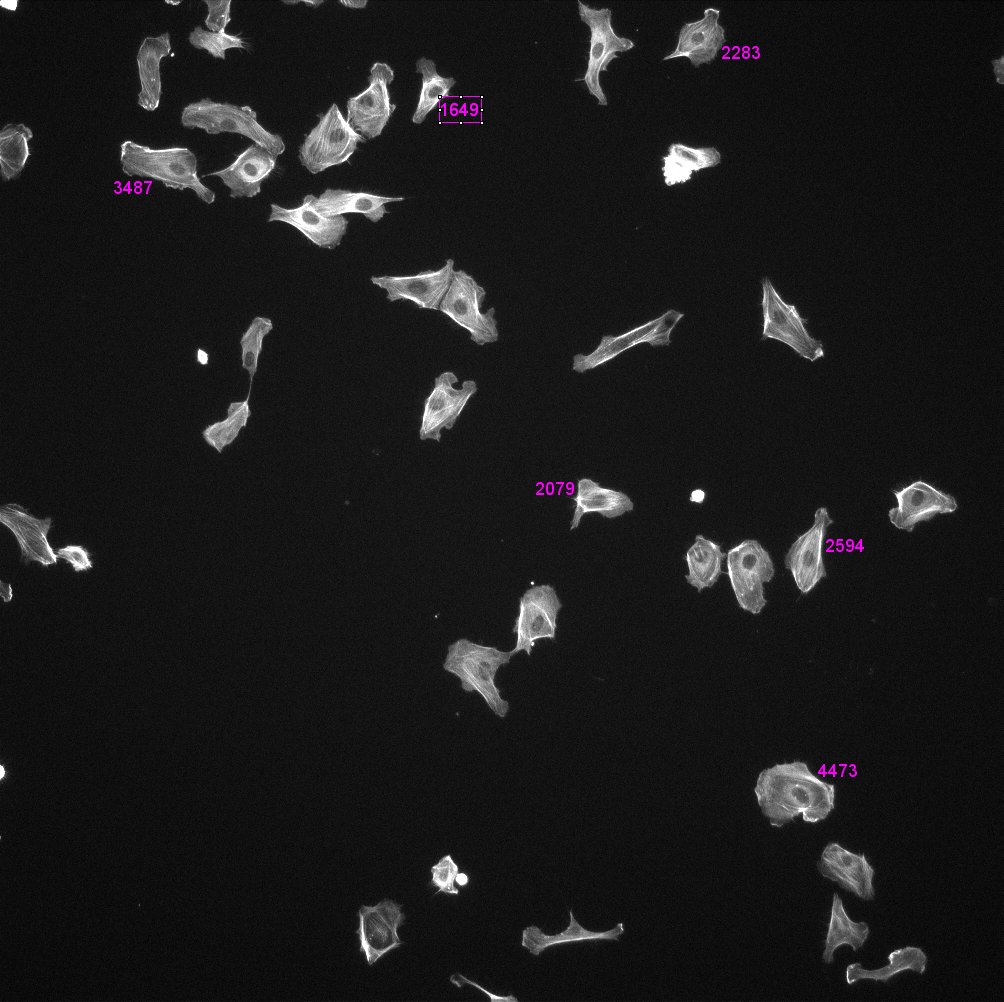
Phallodin Image with Labeled Areas (without Threshold, TCP, 24hr, 10x)
Data:
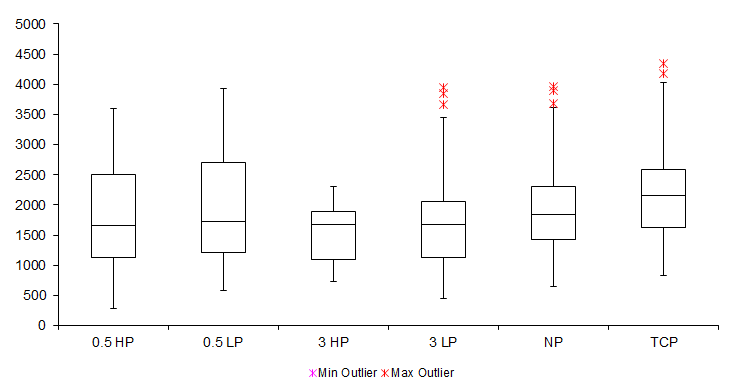
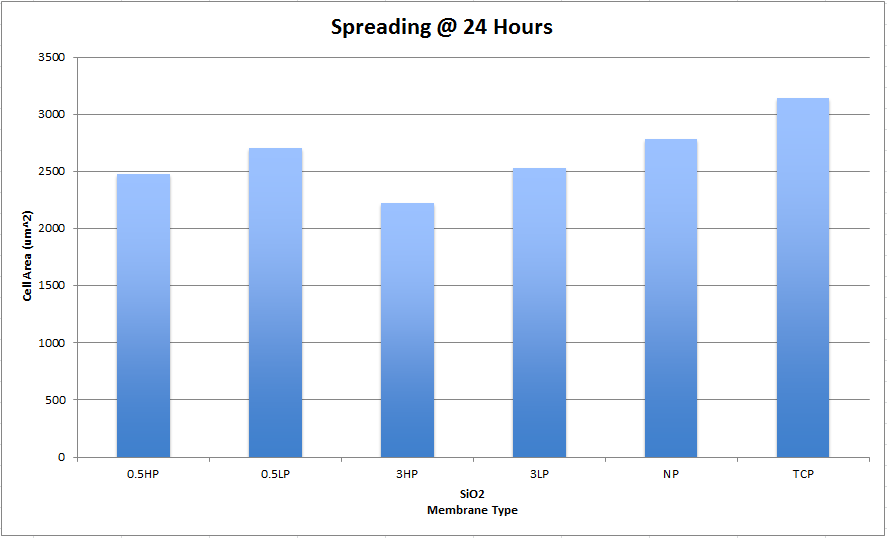
Conclusion:
It was concluded that HUVECs spread most on tcp and least on 3um high porosity membranes. As it is shown in both the graphs the remaining membranes are almost indistinguishable between each other based on cell spreading. The study shows that HUVECs spread the least on the 3 HP membranes, this is not surprising at it only further supports the previously post. As the cells push through the pores of the membrane, the spreading of the cells will be reduced. Tissue culture plastic having the greatest spread area was also not surprising as it has been optimized for cell growth.