Protein Adsorption on PEG1000ed NPN Chip
The presented post is somewhat of a follow-up of this previous post, in which we studied the adsorption of proteins on silanized NPN chips.
In the presented work, we study the adsorption of fluorescent proteins (BSA and IgG) on both the untreated and the PEGylated nanoporous nitride membrane (NPN) chips using epifluorescence as the imaging modality. Untreated (n = 1) and PEGylated (n = 1) NPN chip were incubated (membrane side up) in either 1 mg/mL of FITC-BSA or FITC-IgG for 1 hr, then rinsed/washed in DiH2O and let dry. The NPN chips were then flipped upside down onto a U-shaped gasket (to suspend the membrane from contact) for imaging on an inverted microscope (we specifically image the membrane side to match the XPS data). In this study, glass was chosen as the positive control for protein adsorption.
representative image: FITC-BSA on glass:
![[image] BSA on glass](https://trace-bmps.org/wp-content/uploads/2015/10/image-BSA-on-glass.png)
The mean intensity is ~200 with a standard deviation of ~50 for all the different regions examines (n = 4).
Now onto the protein adsorption on the NPN chips.
To keep the imaging locations somewhat consistent, the regions between each pair of adjacent membranes were chosen. Since there are 5 membranes, 4 “between-membrane” regions were imaged for each chip. The schematics below illustrates a representative sampling:
![[image] BSA_on_PEG1000](https://trace-bmps.org/wp-content/uploads/2015/10/image-BSA_on_PEG1000.png)
This particular sample happened to be the PEG-ylated NPN chip that was incubated with FITC-BSA.
Summary of the FITC-BSA adsorption on the PEG-ylated NPN chip (from the“between-membrane” regions, hence n = 4):
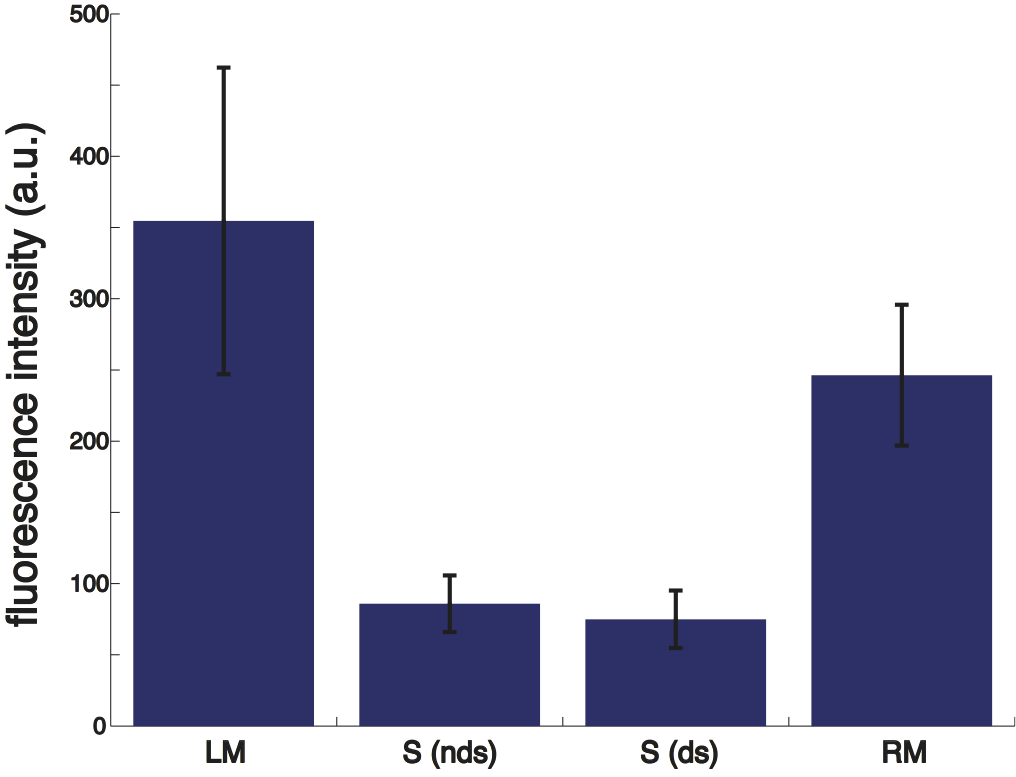
LM = left membrane, RM = right membrane. S(ds) = dark spots of the non-membrane region, S(nds) is the non dark spot region of the non-membrane region. NOTE: for the LM and RM, n = 3, because one membrane was broken.
Consistent with previous observations, large fluctuations in fluorescence were seen at the membranes. This may be due to optical artifacts (i.e. reflection/transmission through the trench) or the trapping of aggregates at the pores, or both. The non-membrane regions have less variability in fluorescence and contain darker spots. Interestingly, these darker spots were only present in PEG-ylated samples. The fluorescence of the darker spots [S(ds)], however, was not statistically significantly different from that of the rest of the non-membrane regions [S(nds)]. NOTE: All data were background subtracted. The background fluorescence is ~80, obtained by imaging at the broken membrane.
Currently it is unclear how these darker spots were formed. Many questions can be asked: 1. Are these dark spots regions with higher degree of PEG-ylation or regions in which the protein solutions were excluded? 2. Can the brighter patch around these darker spots be washed off given a 2nd wash? We are currently in the process of answering these questions. Some of the samples are scheduled to be looked at under the SEM for surface morphology.
Below is the summary of FITC-BSA adsorption on the PEG-ylated and untreated NPN, with glass as control:
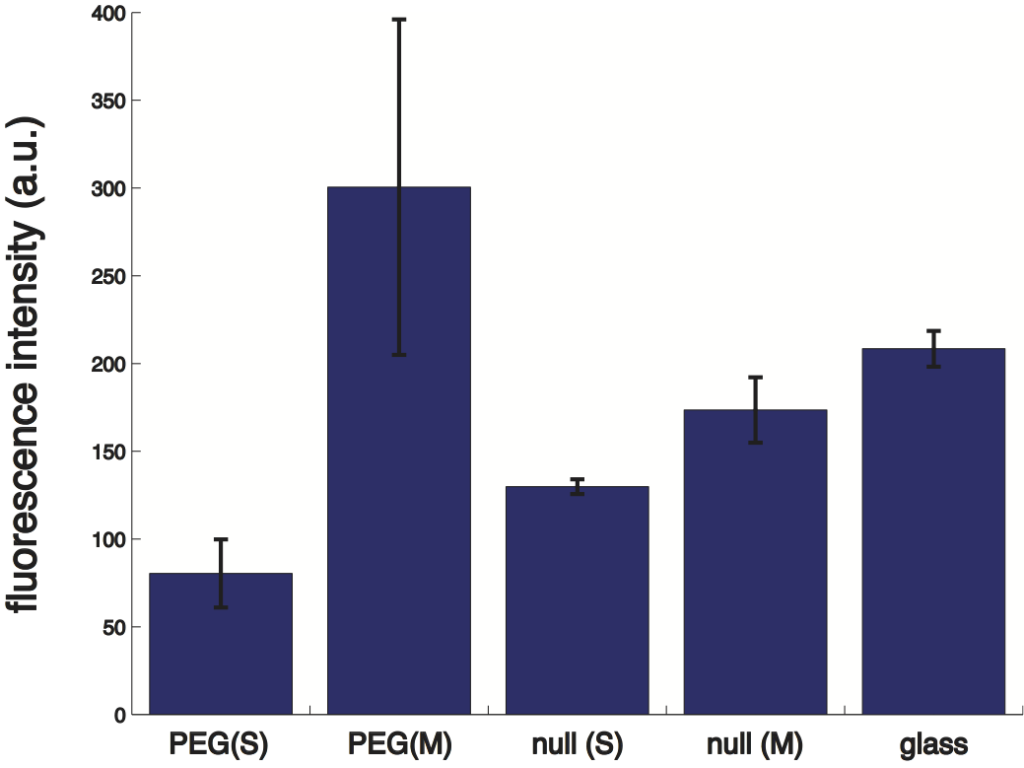
PEG = PEG-ylated, null = untreated, (S) = slit (non-membrane region), (M) = membrane.
If we only look at only the non-membrane regions:

Statistically significant differences were found for all pairwise comparisons (using Student’s T test, with alpha level of 0.05, assuming unequal variance), with PEG-ylated NPN exhibiting the lowest level of fluorescence.
Below is the data summary for the FITC-IgG adsorption
NOTE: this data set may not be taken too seriously since the images are not exact focus during the imaging,
Summary of the FITC-IgG adsorption on the PEG-ylated NPN chip (from the“between-membrane” regions, hence n = 4):
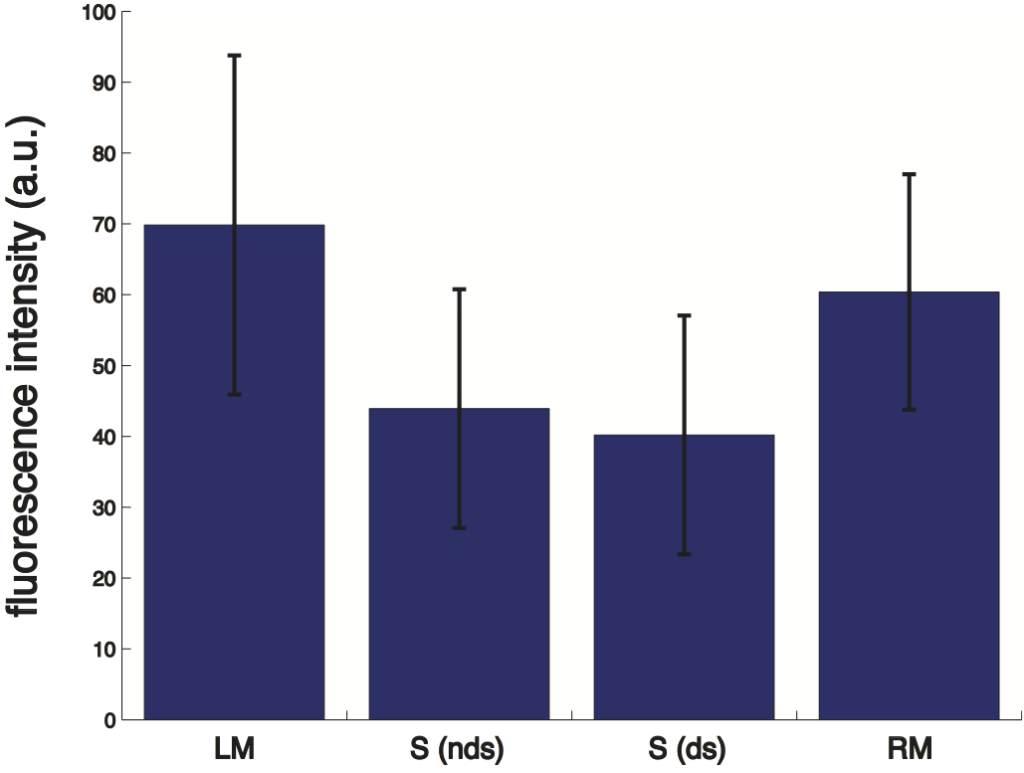
LM = left membrane, RM = right membrane. S(ds) = dark spots of the non-membrane region, S(nds) is the non dark spot region of the non-membrane region. NOTE: for the LM, n = 2; for RM, n = 1; because some membranes were broken.
None of the samples are statistically significantly different from each other (two tailed student’s T-test with unequal variance, alpha level = 0.05).
Below is the summary of FITC-IgG adsorption on the PEG-ylated and untreated NPN, with glass as control:
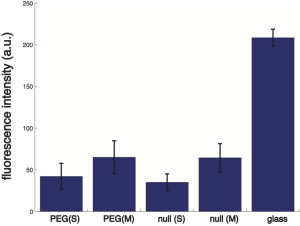
PEG = PEG-ylated, null = untreated, (S) = slit (non-membrane region), (M) = membrane.
The PEG-ylated and the untreated NPN chips are not statistically significantly different in terms of FITC-IgG adsorption (under two tailed student’s T-test with unequal variance, alpha level = 0.05).