Variation of TEER values during cell growth in microfluidic device
In my previous posts so far, I performed simulations to understand the behavior of TEER variation upon changes in electrode and membrane configuration. None of those models addresses the effects of cell growth on the TEER values. In real experiments, people measure the TEER of system before adding the cells (background TEER), and then monitor the changes in resistance on daily basis, by subtracting the background TEER for each measurement. Background subtraction is believed to be “taking care” of system anomalies and is an indicator of incremental resistance offered by the cells. In order to see the effects of cells growth in a microfluidic system, I modeled the geometry of my exact device in COMSOL. In short, my device consists of two ITO electrodes sheets 6×6 mm2 wide separated by a distance of ~1 mm, which consists of our membrane and multiple gasket layers surrounding the membrane. I kept this system geometry and membrane area fixed, and only varied the active area of the membrane to mimic different configurations. Also, since it is computationally demanding to model nanoporous material, I modeled the membrane as a micron thick entity, with conductivity values 1000 more than its original.
In order to simulate the cell growth, I changed the conductivity of cell layer. When cells grow on the membrane, the conducting path gets occluded and proportionately decreases the effective conductivity of the cell layer. Since cell growth obeys exponential, and not linear growth model, I assumed a logarithmic decay of conductivity values. Conductivity at day 0 = media conductivity, i.e. no cells present. The raw data of resistance vs active area looks like this
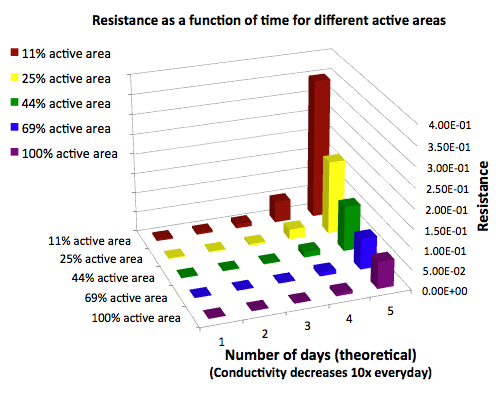
As the time increases the conductivity of the cell layer decreases and the resistance increases. This behavior, although common for all the membrane configurations, the percent increase in resistance is more for lesser active area membranes. Intuitively it makes sense, since the active area is small, resistance is more! However, the background subtraction should get ride of the geometry effects, and should only highlight the values contributed by the cell layer (whose area is equal in all the cases). In spite of this expectation, we don’t see any constant behavior in TEER values even after baseline deletion. Not shown over here is the case, when there is no membrane present: simulations allow us to model hypothetical situations like cells growing without any membrane support. After the baseline subtraction, cells with no membrane, and cells with 100% active area membrane yielded the same value. I attribute this effect to the simplified nature of our modeling. Our system obeys linear superposition. So membrane resistances get subtracted while subtracting the background. Replace the membrane with any other material: as long as a the material is uniformly porous, the subtracted values will stay same. I am not sure if this is the advantage of simulations or limitations. It doesn’t matter what porosity is, but it does matter what active area is.
The trends R and RxA look like this in comparison:

Resistance decreases as the % active area increases. The product of resistance and % active area increases as the active area increases. Clearly the universal convention of multiplying the resistance with the membrane area is not valid for our membrane geometry. Taking a closer look at final day resistances, we see this trend.
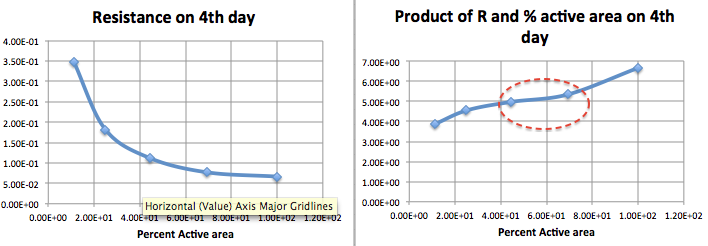
As indicated by the red region, there is a small region in between where the product of resistance and active area doesn’t vary that much with the active area. It implies that, we can compare the TEER values between one membrane system to other as long as the active area lies in a certain fraction of the total area (Still this doesn’t help us in comparing our values with transwell, but nonetheless not completely useless also)
Finally, instead of working with absolute values I decided to non-dimensionalize all the quantities. I divided the cell conductivity value with the the value at Day 0 (i.e. pure media). I divided the individual resistance values from each membrane configuration with the resistance obtained in the absence of any membrane (100% active or ideal) on that respective day.
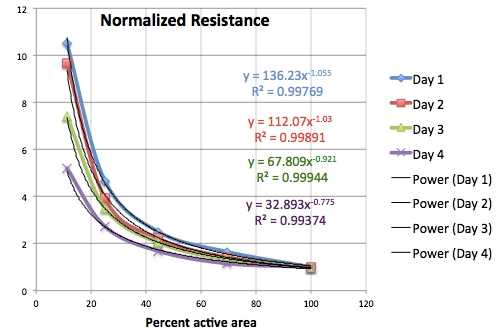
As we can see, as the time increases and the cell resistance increases, the individual resistance values get closer to the unity. This implies the following: once the cells get confluent, the resistance offered by the monolayer dominates over the systemic resistance, and makes the contribution of geometry in determining the total resistance less significant. This, in fact, might be the reason why transwell systems work. Baseline resistance look petty once cells are confluent and system becomes more consistent.