Analysis of Barrett’s old TEER data
This blog is to revisit the old TEER data obtained by Barrett from the coculture experiments on pncSi and polymer membranes. The reason behind this analysis is to understand the differences of the raw resistance values obtained for the same cell type but on different membrane configurations. The data is shown below.
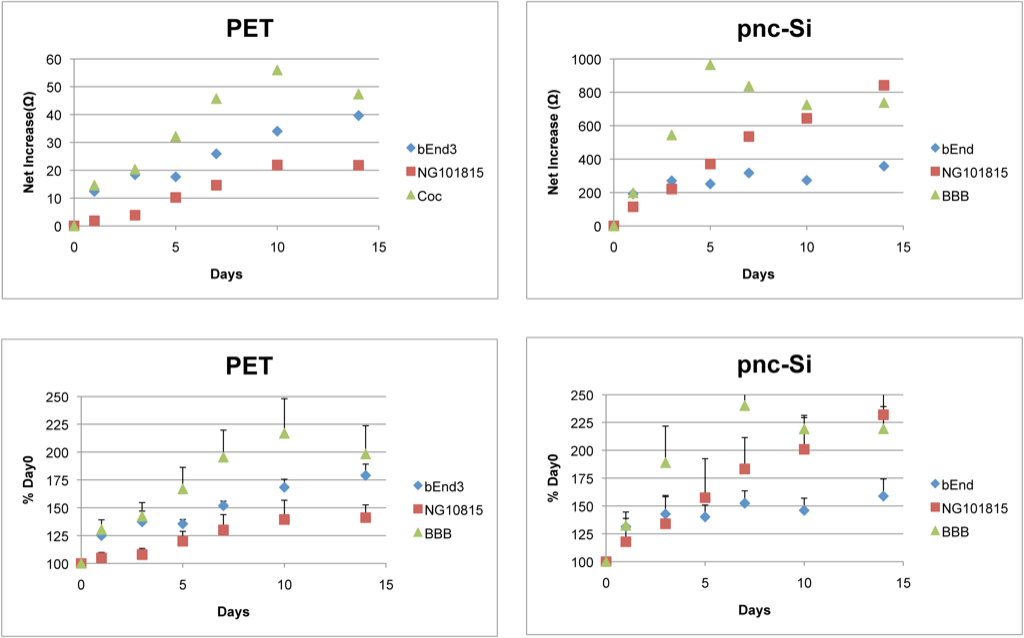
As we can see, the resistance values for just bEnd cells are much higher on pncSi than on polymer. I performed simulations in Comsol to understand these differences and to see if we can capture this phenomenon in my model. Barrett used a endohm cup from WPI to perform his teer experiments. The geometry of endohm looks like this.
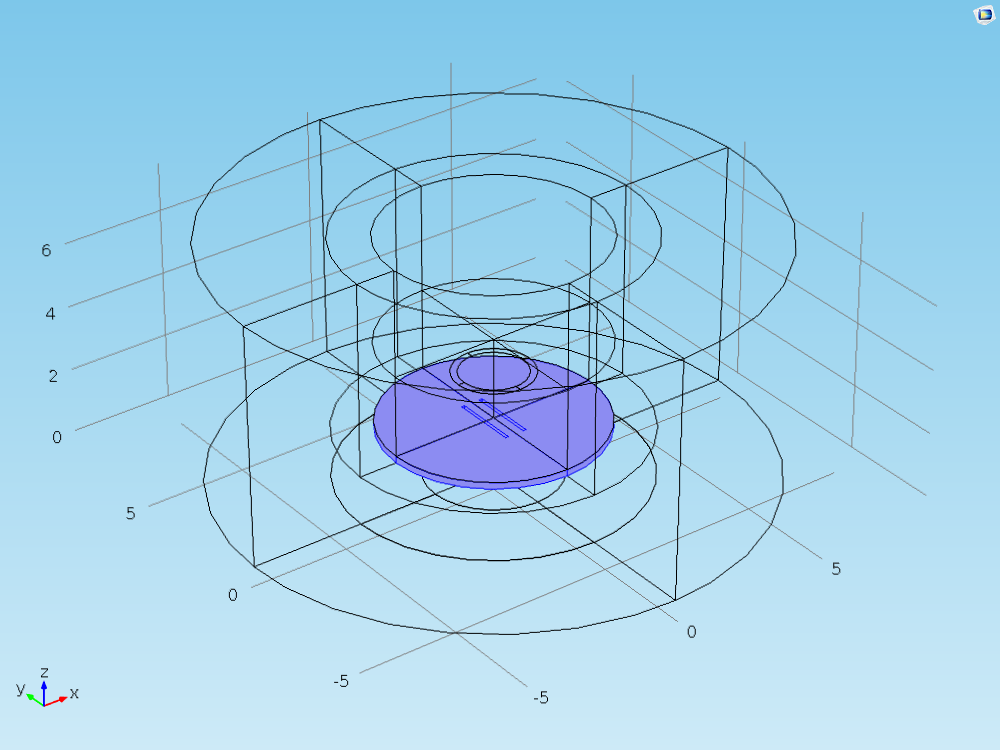
The highlighted circle in the blue is the old pncSi membrane with two slots each of 2×0.1 mm2 in dimensions. The top and bottom chambers are filled with media. Not seen over here is the pair of two concentric electrodes in top and bottom chambers respectively for TEER measurement, The geometry of endohm is well established. The simulation was performed for DC current. The streamlines generated after the simulation look like this.
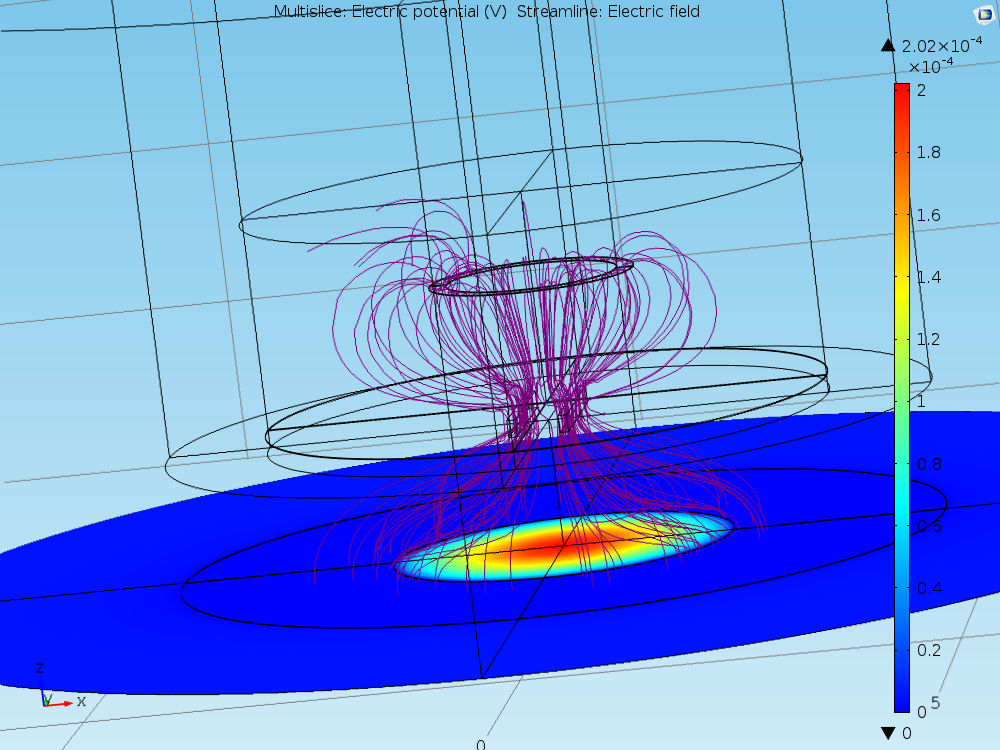
I assign a random but increasing values of conductivity to the cellular layer during my simulations. The TEER obtained can be compared to the assigned values, and thus serves as a sanity check for the simulations. My analysis shows that cells on pncSi always show 2 orders of magnitude values higher than what I assign. The polymer membrane, however, behaves ideally. This is summarized below.
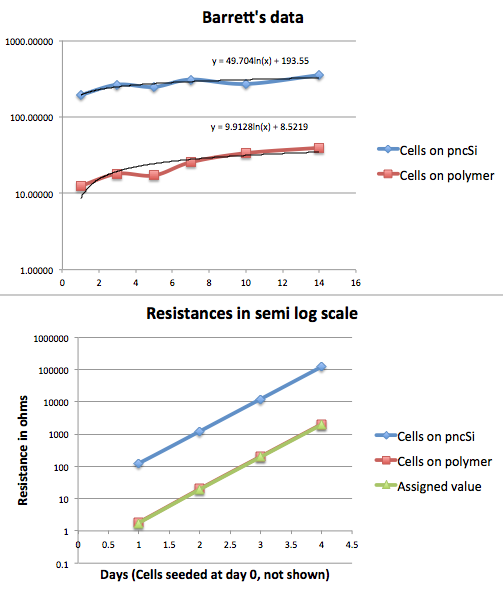
Barrett observed that pncSi resistances are approximately 10x higher than that on polymer, while my analysis says they are 100x higher than polymer. Not sure why! I will add on to this blog soon.