Update on progress with size separation and ALD
This update covers my efforts since our last skype meeting to show DNA size separation in a filter, as well as some very interesting TEM images of ALD-coated NPN and associated controls.
Here is an inventory of my current chips:
Oxide-spacer chips with nitride cap and no filter yet: 8
Oxide-spacer chips with nitride cap and filter: 3
Oxide-spacer chips with no nitride cap and no filter yet: 87
NPN chips: 18
NPN chips with ALD: 10
As you can see, we are getting low on the ones with the nitride cap, which means that experiments going forward will have to move to the ones without if I can’t get the data we need on the remaining few capped ones. That’s not the end of the world – it will mean a 5% reduction in the gap height, but that is unlikely to be enough to make a significant difference so I think we can still compare them directly. From the controls I ran the few chips without the cap seemed a bit more stable anyway, so there may be an upside there.
Depending on how the next couple of weeks go we may need to purchase some more NPN. For the moment there is no urgency, but what sort of lead time would be required if it becomes necessary, just so I know when to ask?
First, the good news: Since I started blowing nitrogen across chips before membrane transfer, the ease and quality of NPN-nitride transfer has improved tremendously. I think it’s safe to say that we were correct about the cause of difficult and wrinkly transfers being large particles caused by breaking NPN chips out of the wafer with inadequate cleaning. Luckily, this did not seem to affect the quality of the actual result, it just made them a bit more difficult to obtain.
Second, the bad news: I have been trying to show that we can size separate DNA molecules using the dwell time when they are in the filter system, but I have been getting very strange results. This has been compounded by difficulties caused by unstable membranes, so once I have gone through this batch of SiN capped chips I’ll move to the non-capped ones and hope the stability is improved.
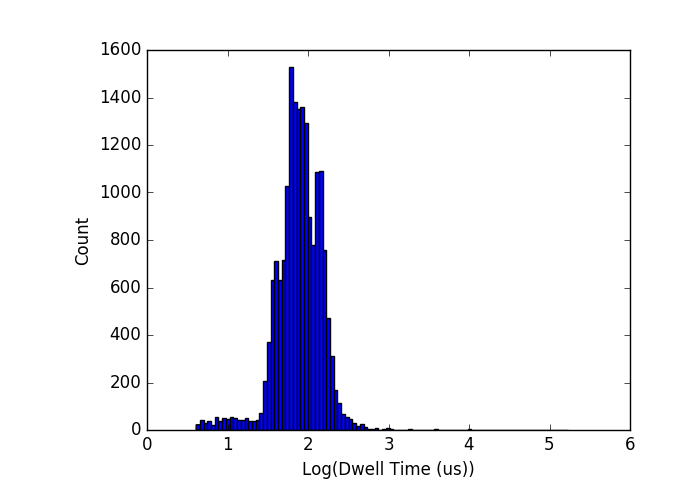
When I simply take the distributions that I have found for individual runs using the sizes of interest (500, 1000, 1500-bp, revised from 500-750-1000 since I think those are too close to separate reliably) I get the plot below as our baseline expectation:

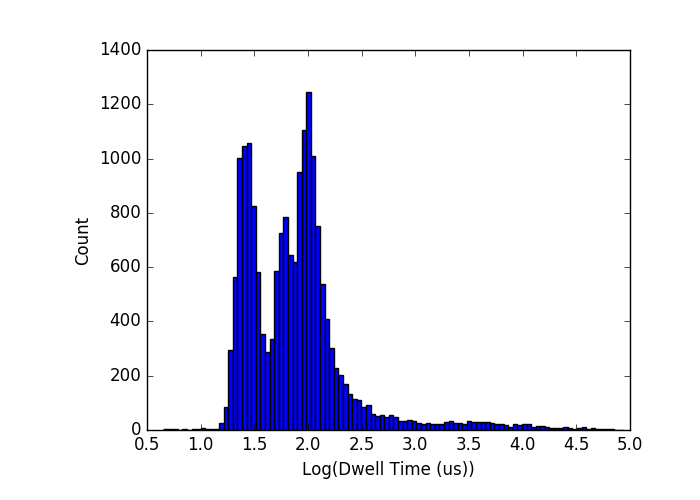
When I run this with an actual mixture of DNA, the widths of the distributions have been much larger than they have been for each DNA size alone thus far. My first attempt used 4 sizes because I was feeling lucky (500, 750, 1000, 1500):
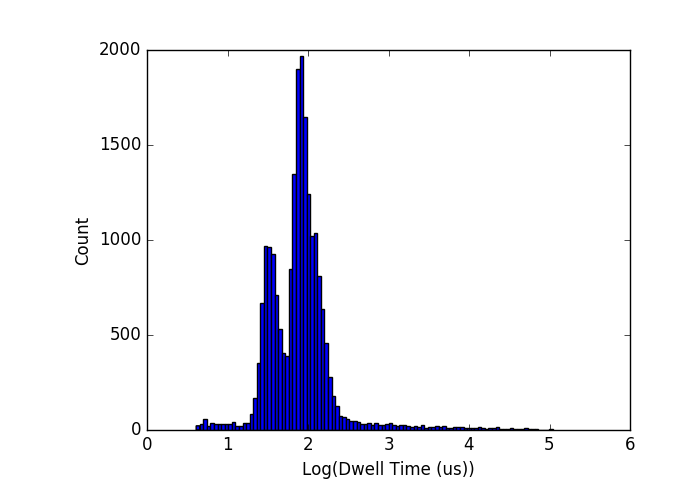
There are clearly a few sub-peaks, but they aren’t distinguishable or well-separated. My second attempt used 500, 1000, and 1500, and did show 3 peaks in the right mean positions, but the widths are much larger than I would have expected for these molecules alone:
Certainly they don’t fit the trend of the rest of the filter data.
My most recent attempt was a pretty ugly more that needed extensive baby-sitting, so I’m not too surprised that the results are garbage, but this one was also 500, 1000, and 1500 bp:
The 1000-bp peak has disappeared.
I don’t really understand why I would see larger variance in dwell time distributions when there is a mix of DNA versus a single size. This is double-stranded DNA, so there should be little to no interaction between the molecules. Unfortunately NoLimits refuses to release sequence information, so I can’t be sure that sequences are not overlapping (and realistically it’s highly likely that they are, since I assume these fragments are all cut from the same template). I’m starting to wonder if maybe there are significant overlapping sections of bases, which are (somehow) causing entanglement between the different DNA sizes through unzipping and the like. This is grasping at straws, however, since at room temperature I would not expect to see that sort of thing regardless. I need to read up further to understand this potential issue. If this is what is happening (Vincent, can you comment here?) then we might be out of luck unless we design our own molecules, which comes with an entirely different set of challenges.
For the time being, I will aim for the slam dunk experiment: get translocation data on each of the three sizes individually, and then get data on the mixture. If I can show that there is a systematic difference in variance when there is a mix vs when there is not, we can attribute it to the mixing (somehow) and discuss that. The reason I have been unable to get that data set so far is instability – since the meeting, none of my pores have lasted long enough to do it yet. That may change when I move to the uncapped ones, we’ll see.
The final component to the update concerns some very interesting results of ALD-coating and TEM imaging NPN membranes in an attempt to shrink the pores. I elected to perform 160 cycles of Hafnia, which should coat 16-20nm of Hafnia on the NPN. In principle this would close all the NPN pores, but I recall reading that as pores shrink the assumption of conformal coating breaks down a bit and the efficiency drops, so this should leave relatively small openings. First, the control images:
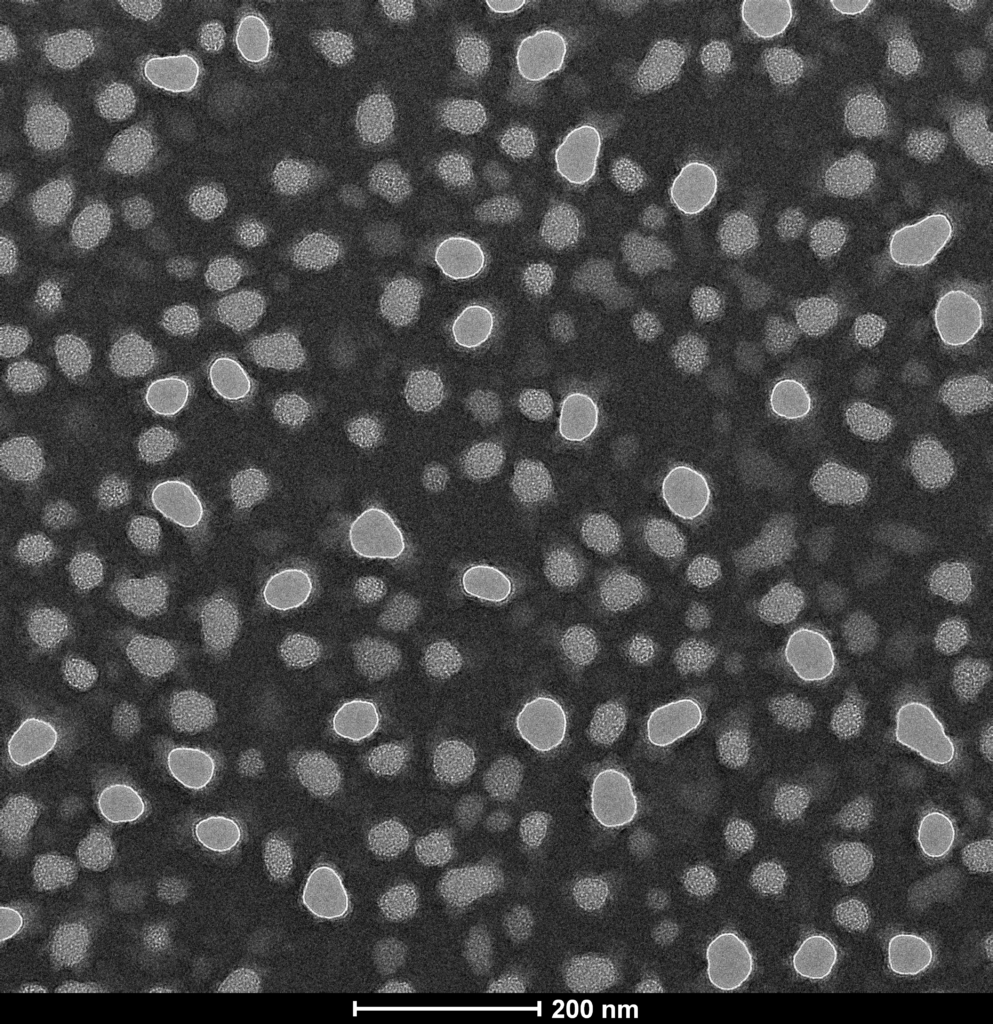

Some things of note: by under-focusing the TEM slightly, the contrast is improved and we can see there are two types of features. On the top image (zoomed in) there are features with a white line around them (through holes) and features with texture inside, which are not through holes. I haven’t yet figured out any image processing software, but a quick glance suggests that the average through hole diameter is closer to 50-nm, while the average feature size in general is more like the 35-nm I expected to see, since the through holes are generally larger than the rest of the features.
When I do ALD, we see further evidence that not all the features are through-holes: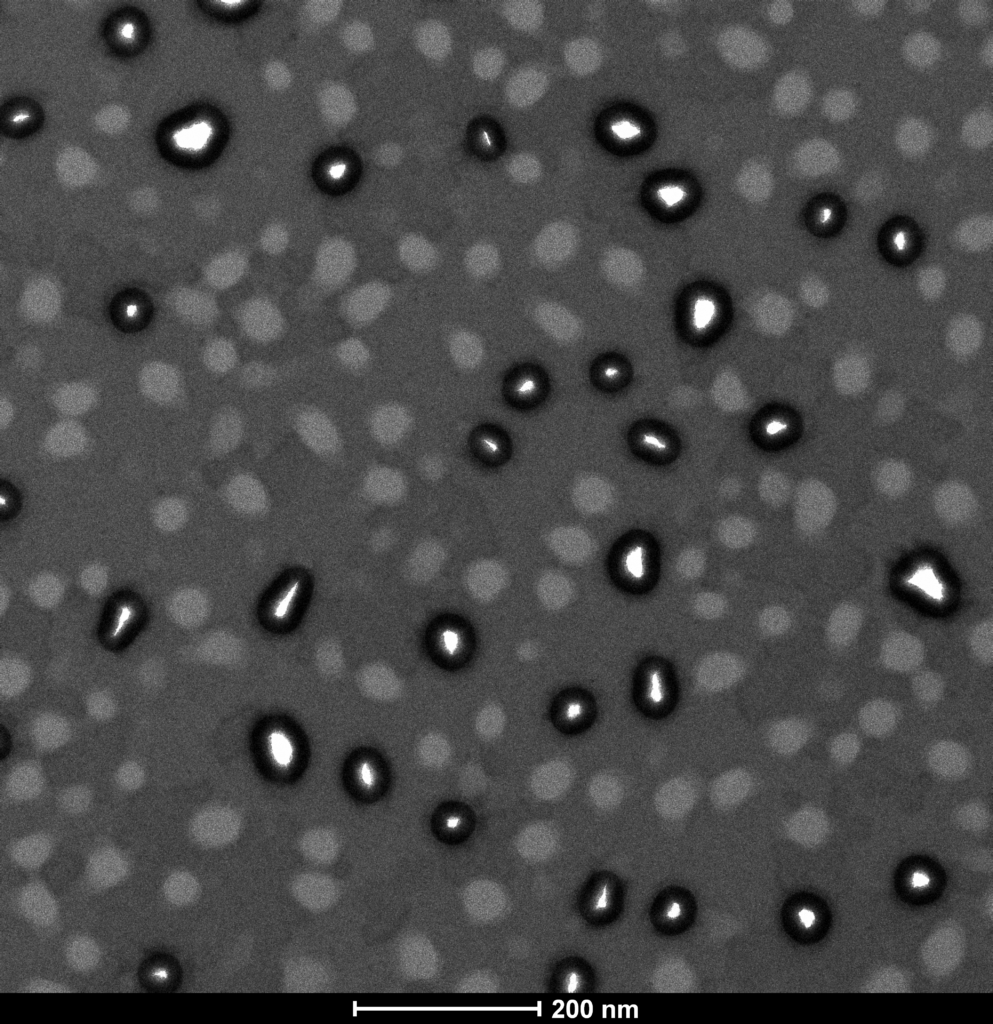

Only the subset of pores that show no internal texture actually get a layer of ALD inside them, while the rest of the features just get a little less contrast with the surroundings. This is consistent with the ALD procedure, since it coats the entire membrane in 20nm of Hafnia, meaning that most of the membrane is 50nm SiN + 20nm HfO, while the coating around the inside of the through holes is 70-nm HfO, which is denser and therefor darker on the TEM. I’m not 100% sure why we don’t see a darker edge around the rest of the features, but I believe the way I have been coating ALD will coat poorly on the back side of the chip, so maybe the indentations are preferentially on the side of the membrane with poorer HfO coverage. Can you comment if any such asymmetry would exist?
A quick back of the envelope calculation suggests that the porosity of these membranes is closer to 4-8% than to the 14% quoted originally. I’m guessing this is something you have seen before – whatever etch process is used to make the NPN doesn’t quite go all the way through all the time, and the subset of features which are through-holes are generally larger diameter than the ones that failed to make it through. Are these images and explanation consistent with your expectations?
Short term we may have to revise the pore size/porosity estimates a bit for the paper, but there’s no urgency there. I plan to back-burner image analysis until the lab is shut down for the move, since that’s something I can work on without any equipment. If you would like me to send over images, I have 4 of the zoomed in ones for each of ALD and control.
So, in summary:
1 – membrane transfers work better when particles are removed with a flow of nitrogen
2 – Size separation of DNA has posed some unexpected and so far unexplained challenges, but experiments continue
3 – ALD/TEM imaging reveals that the NPN properties appear to be a bit different from expected, but that the ALD coating was successful in shrinking the pores. Experiments with ALD-NPN will start after size separation has been finished.
Kyle,
if the DNA fragments are blunt ends – there is no way these are unzipping when in contact with other fragments. You could ask Philipp to run a gel for you to confirm that the mixture is not affected. But I really doubt that explanation.
Something else is happening here… We need to brainstorm.
The relative concentration of each length could be off. I am not sure how accurate their scale 10ug scale is. But that cannot explain the results, just the relative height of the peaks.
Yea, it’s a stretch for sure. The fact that the distributions work alone means the size is accurate (or at least consistently inaccurate). It must be a concentration effect like Jim mentioned.
We have some smaller pore NPN materials that we can use to restock your NPN batch. I’ll get some specs and post here shortly for you to check against your needs.
The incomplete through pore etching is not what we expect. When we first made this material (Desormeaux et al., 2014), we tested our measured porosity and pore size estimates by measuring fluid flow and comparing to theory. There was good agreement. Some things have changed since that time including SiMPore using a pore analysis approach that is different than the one we originally developed. The feedback here is useful and we’ll learn from it.
We have seen that the sieving behavior of a mixture of nanoparticles is more complex than one would predict from the sieving behavior of the nanoparticles individually. How a pore appears to a small particle in the neighborhood of a recently rejected larger one may be complex enough that we can’t assume a simple superposition of the individual experiments. Not the same system as yours, but perhaps there are similar concerns.
Interesting observation about nanoparticle mixtures. Does the difference disappear in the limit of low concentration? Perhaps my next test should be to reduce all concentrations by a factor of 10 or so and see if the distributions improve.
Correct me if I’m wrong: when I suggested higher porosity membranes earlier you said it would be complicated since Simpore wanted to stick with their protocol. But if this batch was atypical, then there might be room to improve porosity by a factor of 3 or so up to the expected 14%?
Kyle: What lot number NPN wafers did you use for these images? How was the NPN treated before imaging? It looks like something has filled in the pores.
The lot number was 1156. The membranes were plasma cleaned (~30s, ~40W) prior to ALD deposition. The membranes have been stored in the box they were sent, albeit not in a clean room.