HUVEC migration on porous substrates
Goal: study HUVEC migration on different porous substrates.
HP = high porosity 0.5 μm SiO2 membrane
LP = low porosity 0.5 μm SiO2 membrane
NP = non-porous SiO2 membrane
TCP = tissue culture polystyrene (~3 GPa [ref 1, 2])
P184 = sylgard 184 (a commonly used PDMS; Young’s modulus = 1.74-1.84 MPa [ref 3])
P527 = sylgard 527 (a soft PDMS variant: Young’s modulus ~5 kPa [ref 3])
The letter A, B, C, and D after each abbreviation denote the different repeats within the same experiment.
The number 1, 2 at the end denotes the different experiment (conducted at different days).
ref 1 = Miyake, Koji, Noriaki Satomi, and Shinya Sasaki. “Elastic modulus of polystyrene film from near surface to bulk measured by nanoindentation using atomic force microscopy.” Applied physics letters 89.3 (2006): 031925.
ref 2 = Silvani, G., et al. “Gene expression modulation in stretched muscle cells.” World Congress on Medical Physics and Biomedical Engineering, September 7-12, 2009, Munich, Germany. Springer Berlin Heidelberg, 2009.
ref 3 = http://journals.plos.org/plosone/article?id=10.1371/journal.pone.0051499
==============================================================================
24 well plate was used to host the experiment
15 mL of DiH20 was placed in the plate trough to fight off evaporation
35 mL of of DiH20 was placed in the Tokai Hit stage heater to fight off evaporation
Stage heater temperature = 45 °C
top plate temperature = 50 °C
5% CO2 outlet pressure = 18 psi
Tokai hit CO2 outlet flow rate = 250 mL/min
==============================================================================
– 1% geltrex coating for 30 min, then let dry
– 20 uL of HUVEC on top, 100 uL of media on bottom
– after 30 hr of HUVEC adherence, 800 uL of media was used to flood each well
– the entire 24 well plate was then placed in incubator for 24 hr before imaging.
==============================================================================
Exposure time = 50 ms
image every 15 min for 24 hr
==============================================================================
NOTE: the media is still a bit pink so perhaps the CO2 dissolution in media is not optimal. Nevertheless, from all movies the migrating HUVEC did not show any notable signs of slowing down. The pH before and after the migration experiment: pH7.5, and pH8.
movies of representative cell migration:
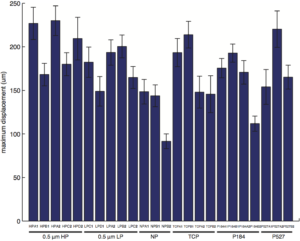
Note:
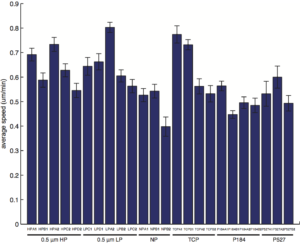
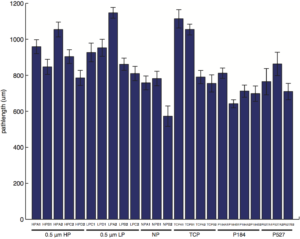
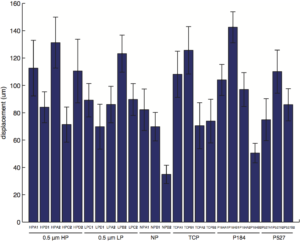
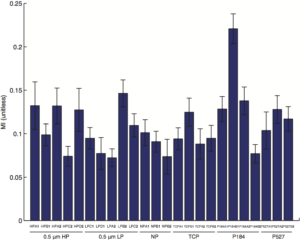
1. The error bars represent the standard error of means.
2. Note: Usually at least 30 cells are analyzed per movie.
3. It is comforting to see that the average HUVEC speed measured is consistent with existing work:
Yin, Zhizhong, et al. “Analysis of pairwise cell interactions using an integrated dielectrophoretic‐microfluidic system.” Molecular systems biology 4.1 (2008): 232.
https://www.ncbi.nlm.nih.gov/pubmed/?term=Analysis+of+pairwise+cell+interactions+using+an+integrated+dielectrophoretic-microfluidic+system
4. The average speed and pathlength data almost look identical because average speed = pathlength/time. Since most cells are tracked throughout the entire movie, the traveled times are all nearly identical (24 hr). The average speed is thus directionally proportional to pathlength in this data set.
5. MI = displacement/pathlength. Displacement = the start to end distance of a cell. MI describes the effectiveness of a cell in maintaining the same direction of migration. For cells that travel persistently in one direction, MI = 1. The less directional the cell, the lower the MI.
6. Maximum displacement = the maximum distance between two points along a cell migratory path. In a sense, maximum displacement describe the area covered by a cell as it moves. When a cell move back toward its starting position, the displacement would approach a value of 0. whereas maximum displacement would not.