Simulating Protein Diffusion
I’ve been attempting to simulate protein sieving using the COMSOL model. This first figure shows the comparison of the simulated separations to the actual results as determined by gel densitometry.
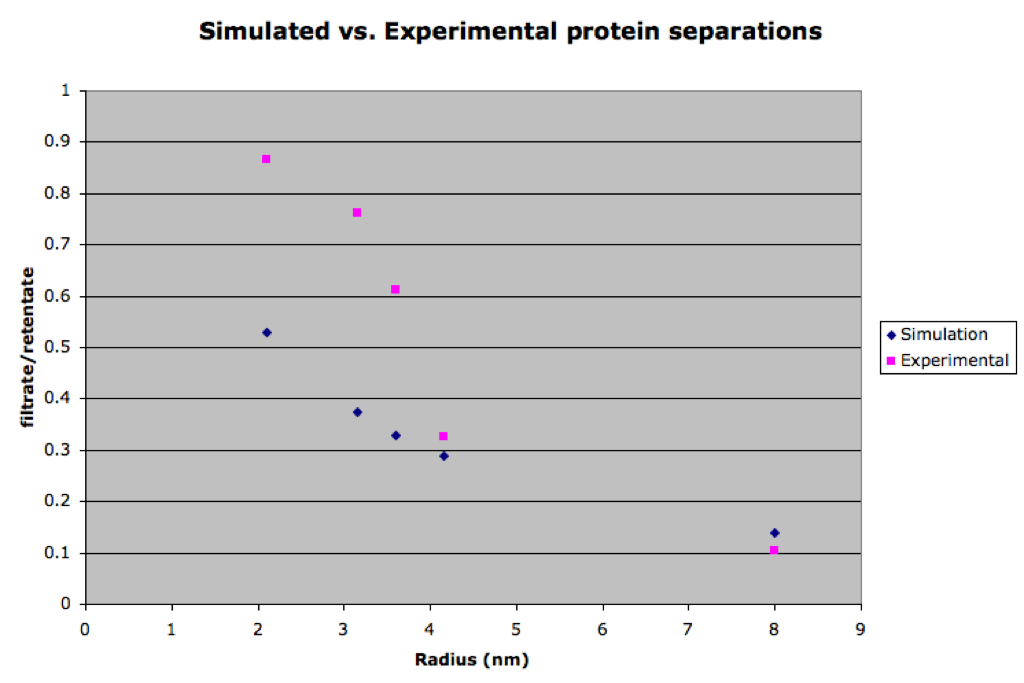
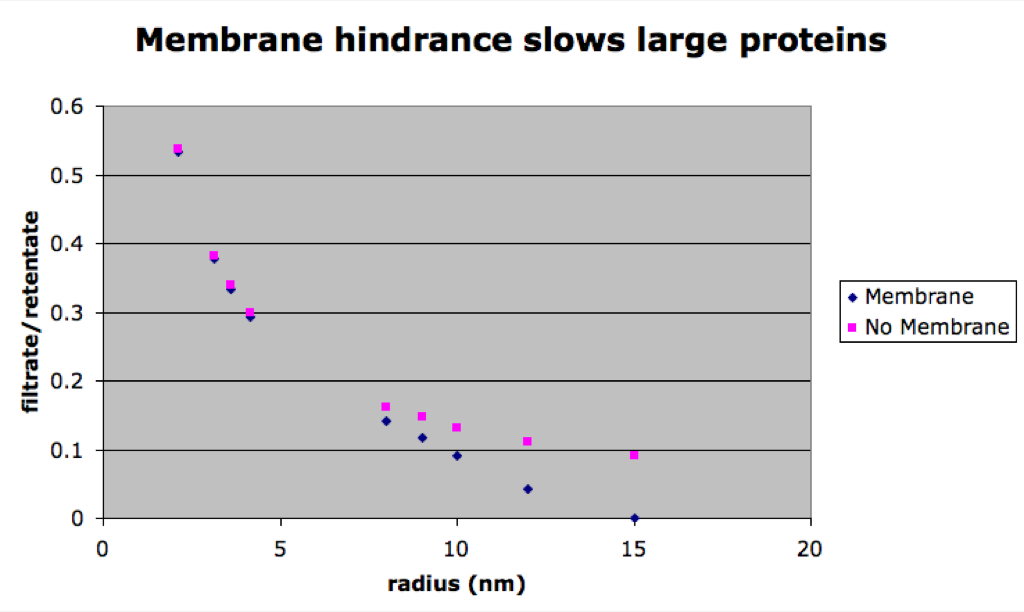
The simulated separations tend to lag behind the experimental data for smaller proteins. This is surprising since the simulation is faster than experimental results for the small molecule rhodamine. After carefully going through my equations for the diffusion coefficient in the membrane (DM), I found that the free diffusion coefficient has a larger effect on the results of the simulation than DM. This means the membrane presents little or no resistance to diffusion. However, we would expect that there is significant resistance for bigger molecules that approach the size of the pores. To study this, a simulation lacking a membrane was compared to one with a membrane for differently sized molecules. The next figure shows that DM does become significant for the larger molecules (avg pore size for this membrane is 14.9 nm).
Finally I’ve looked at different time points of the simulated separations to see if the discrepancy was just due to unit error/poor modeling due to time. The next figure shows traces of the filtrate:retentate ratios for a series of differently size molecules.
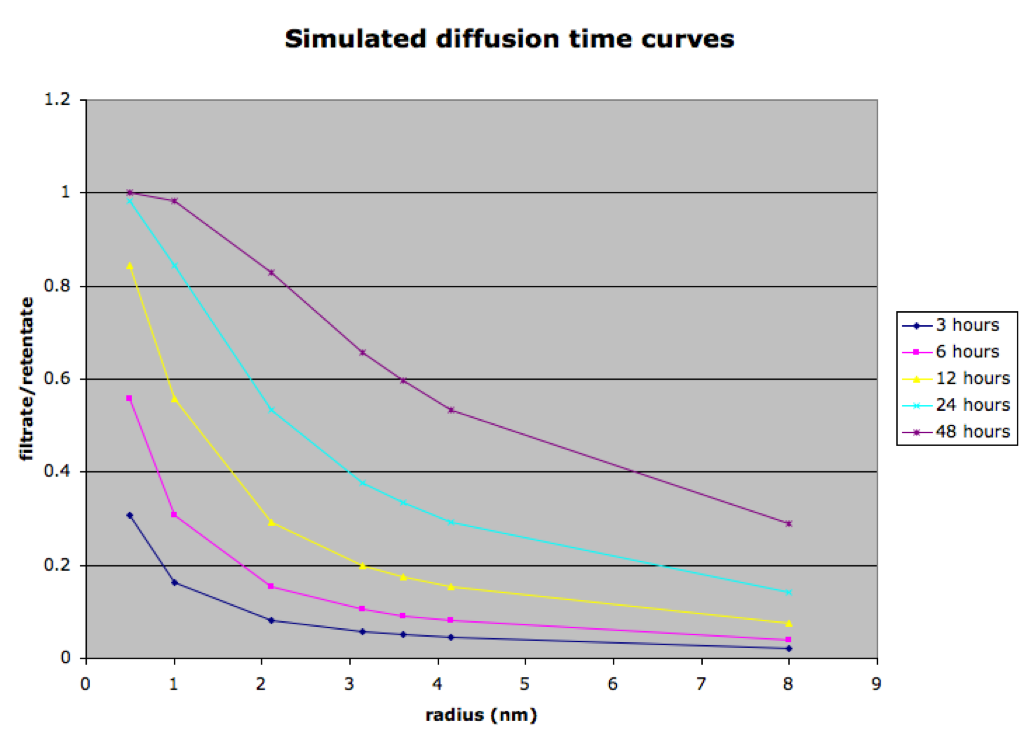
In this case it seems that as time progresses, all species below the cutoff will eventually pass through the membrane. The shape of the curve however doesn’t at any time agree with the experimental curve (Figure 1). Perhaps there’s some inherent problem with the model. It’s also possible that I was wrong in my determination of the sizes of these proteins (from crystal structures). The wrong sizes would shift the graphs and also change my simulated diffusion coefficients. Experimentally I could check this by finding sizes and diffusion coefficients of the molecules using the zetasizer (proteins would have to be purchased).