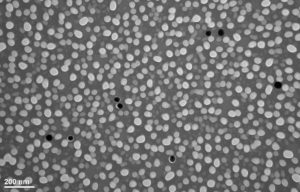
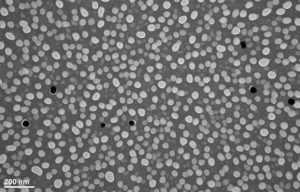
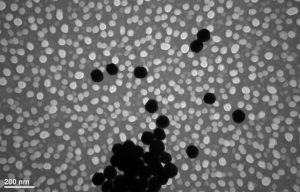
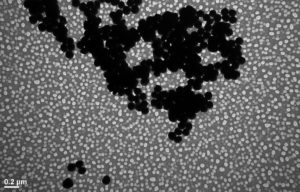
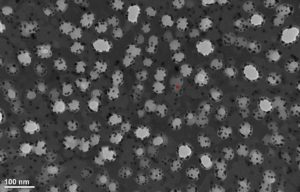
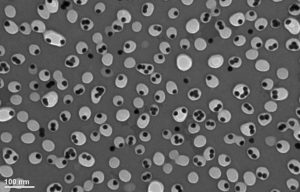
TEM images of dried gold solutions
For the modeling paper, I had to precisely quantify the distribution of gold nanoparticles in the BBI solutions. To do this, I dried the stock solutions of particles on TEM grids (I don’t know what chips I used, but I seem to recall – and take this with a grain of salt – that the grids I used were from wafer 1070 and had variable amounts of alumina on their surface. I believe I pipetted about 1 uL of fluid on each TEM grid. For particles larger than 50 nm, I had to pipette 1 uL, dry, pipette another uL, and dry, since the concentration was so much lower. The chart I derived looked like this: 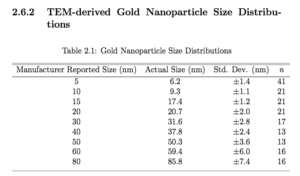
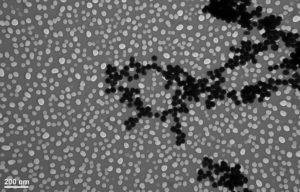
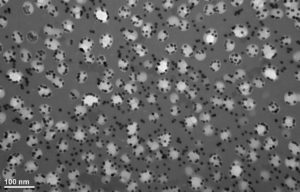
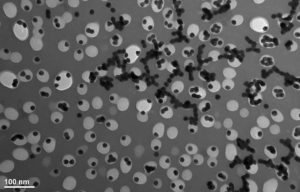
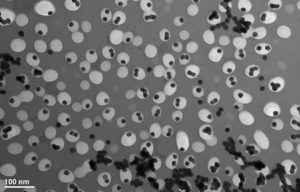
I thought this might have application to some of Kilean’s experiments, so below are JPEGs of these images. I have the raw tiffs if anyone would like them.
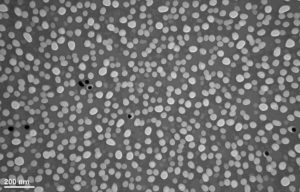
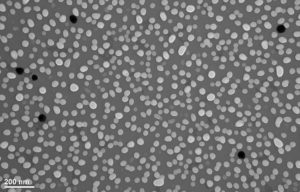
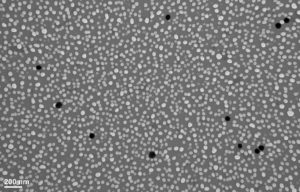
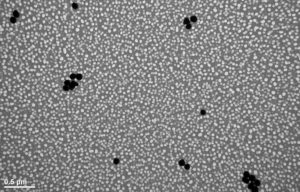
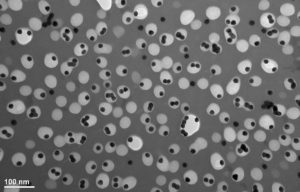
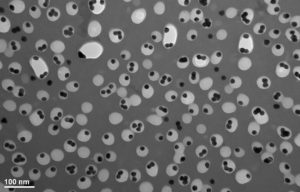
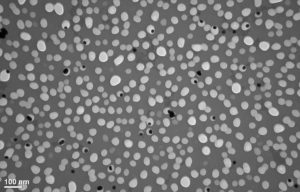
5 nm gold:


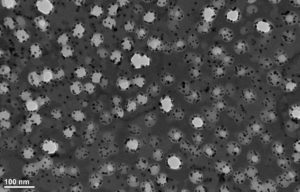

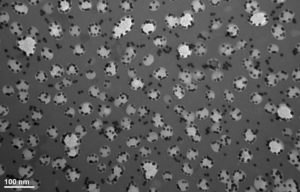
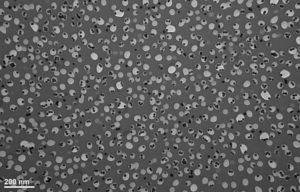
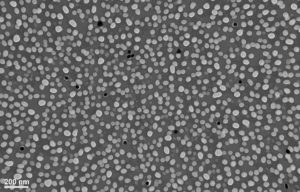
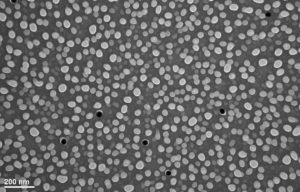
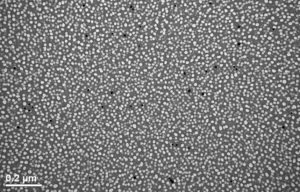
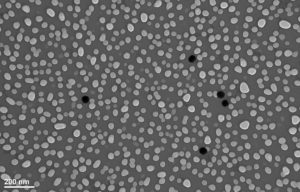
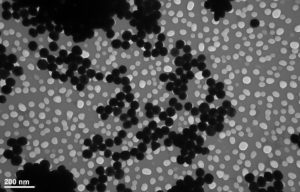
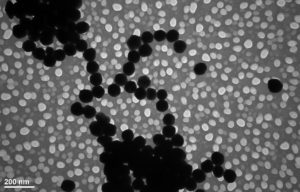
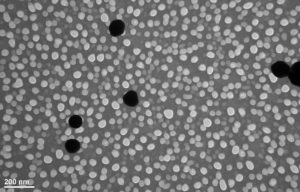
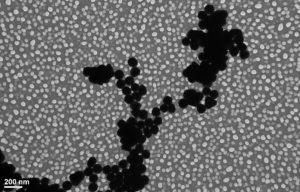
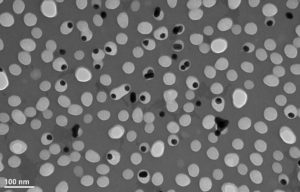
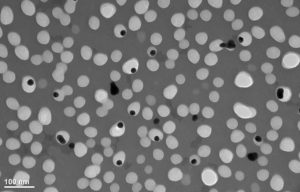
20 nm gold:
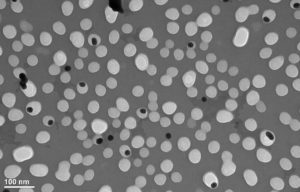
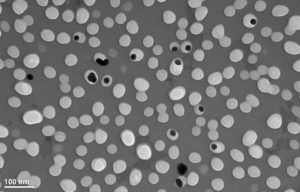
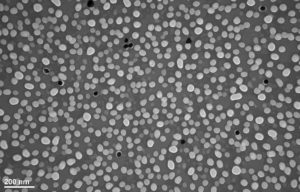
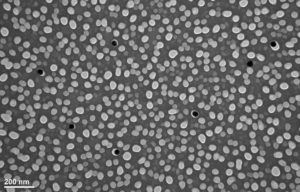
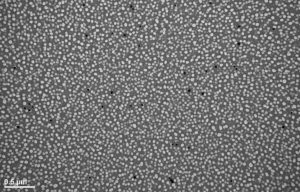
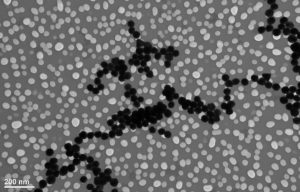
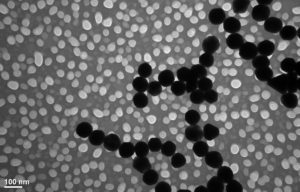
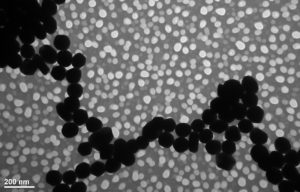
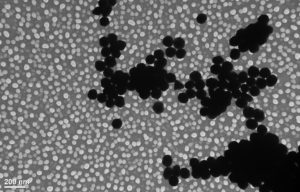
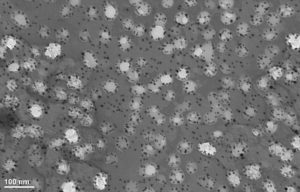
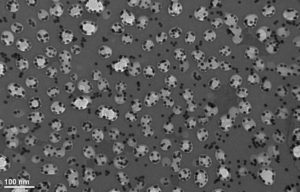
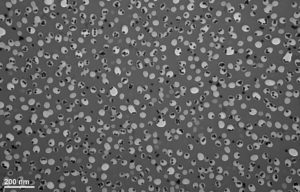
30 nm gold: