NanoParticle Tracking Analysis
Hello Everyone,
Kilean helped us to set a training session for NanoParticle Tracking Analysis (NTA) in UR Medical Center. For this training session, i had 4 samples including: Beads, Liposomes, Media + 10% serum, and PBS. Here is a summary of what we learned, i am also summarizing a paper that i found for comparing NTA and DLS.
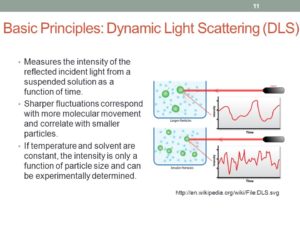
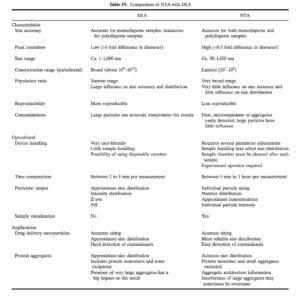
DLS is the most user-friendly technique for size, and it yields relatively accurate and consistent results that can be obtained in a rather short period of time. Therefore, DLS has become the preferred technique to routinely determine the size of nanoparticles. Despite being a powerful and accessible tool, DLS is also known to have several drawbacks, which are mainly inherent to the principles of the technique. Particle size is determined from fluctuations in scattered light intensity due to the Brownian movement of the particles. The fact that the intensity of the scattered light is proportional to the sixth power of the particle diameter makes this technique very sensitive to the presence of large particles. This can be an advantage if the purpose is to detect small amounts of large particles, but it can be a major drawback for accurate size determination. Dust particles or small amounts of large aggregates can impede the size determination if the main component exhibits a distinctly smaller size.
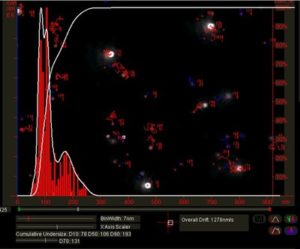
Nanoparticle tracking analysis (NTA), which was first commercialized in 2006, is an innovative system for sizing particles from about 30 to 1,000 nm, with the lower detection limit being dependent on the refractive index of the nanoparticles. This technique combines laser light scattering microscopy with a charge-coupled device (CCD) camera, which enables the visualization and recording of nanoparticles in solution. The NTA software is then able to identify and track individual nanoparticles moving under Brownian motion and relates the movement to a particle size according to the formula derived from the Stokes-Einstein Eq.

Points using NTA:
1. Very time consuming process because of the cleaning step, we had a really hard time cleaning to run the next test, at the end we gave up and decided to run next sample being aware of the fact that we would have some background noises from previous tests. How reliable?
2. The acceptable concentration range is E7 – E9/mL, so a rough estimation of your sample concentration is required, so you need to dilute or concentrate your sample to the acceptable concentration range.
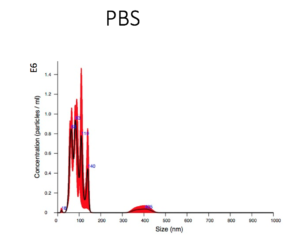
3. PBS showed E6/mL as the background signal.
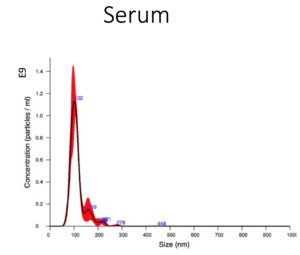
4. Serum showed E9/mL.
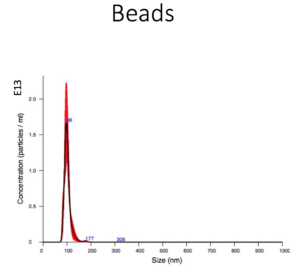
5. Beads sample concentration was E13 which is in agreement with was reported.

Following table is showing a great comparison between DLS and NTA:
Source:
Critical Evaluation of Nanoparticle Tracking Analysis (NTA) by NanoSight for the Measurement of Nanoparticles and Protein Aggregates, Filipe et al, May 2010, Pharmaceutical Research.