Automated cell tracking using the SiR-DNA label
Hi all, recently we improved cell tracking with the use of SiR-DNA label (see highlights below).
random migration: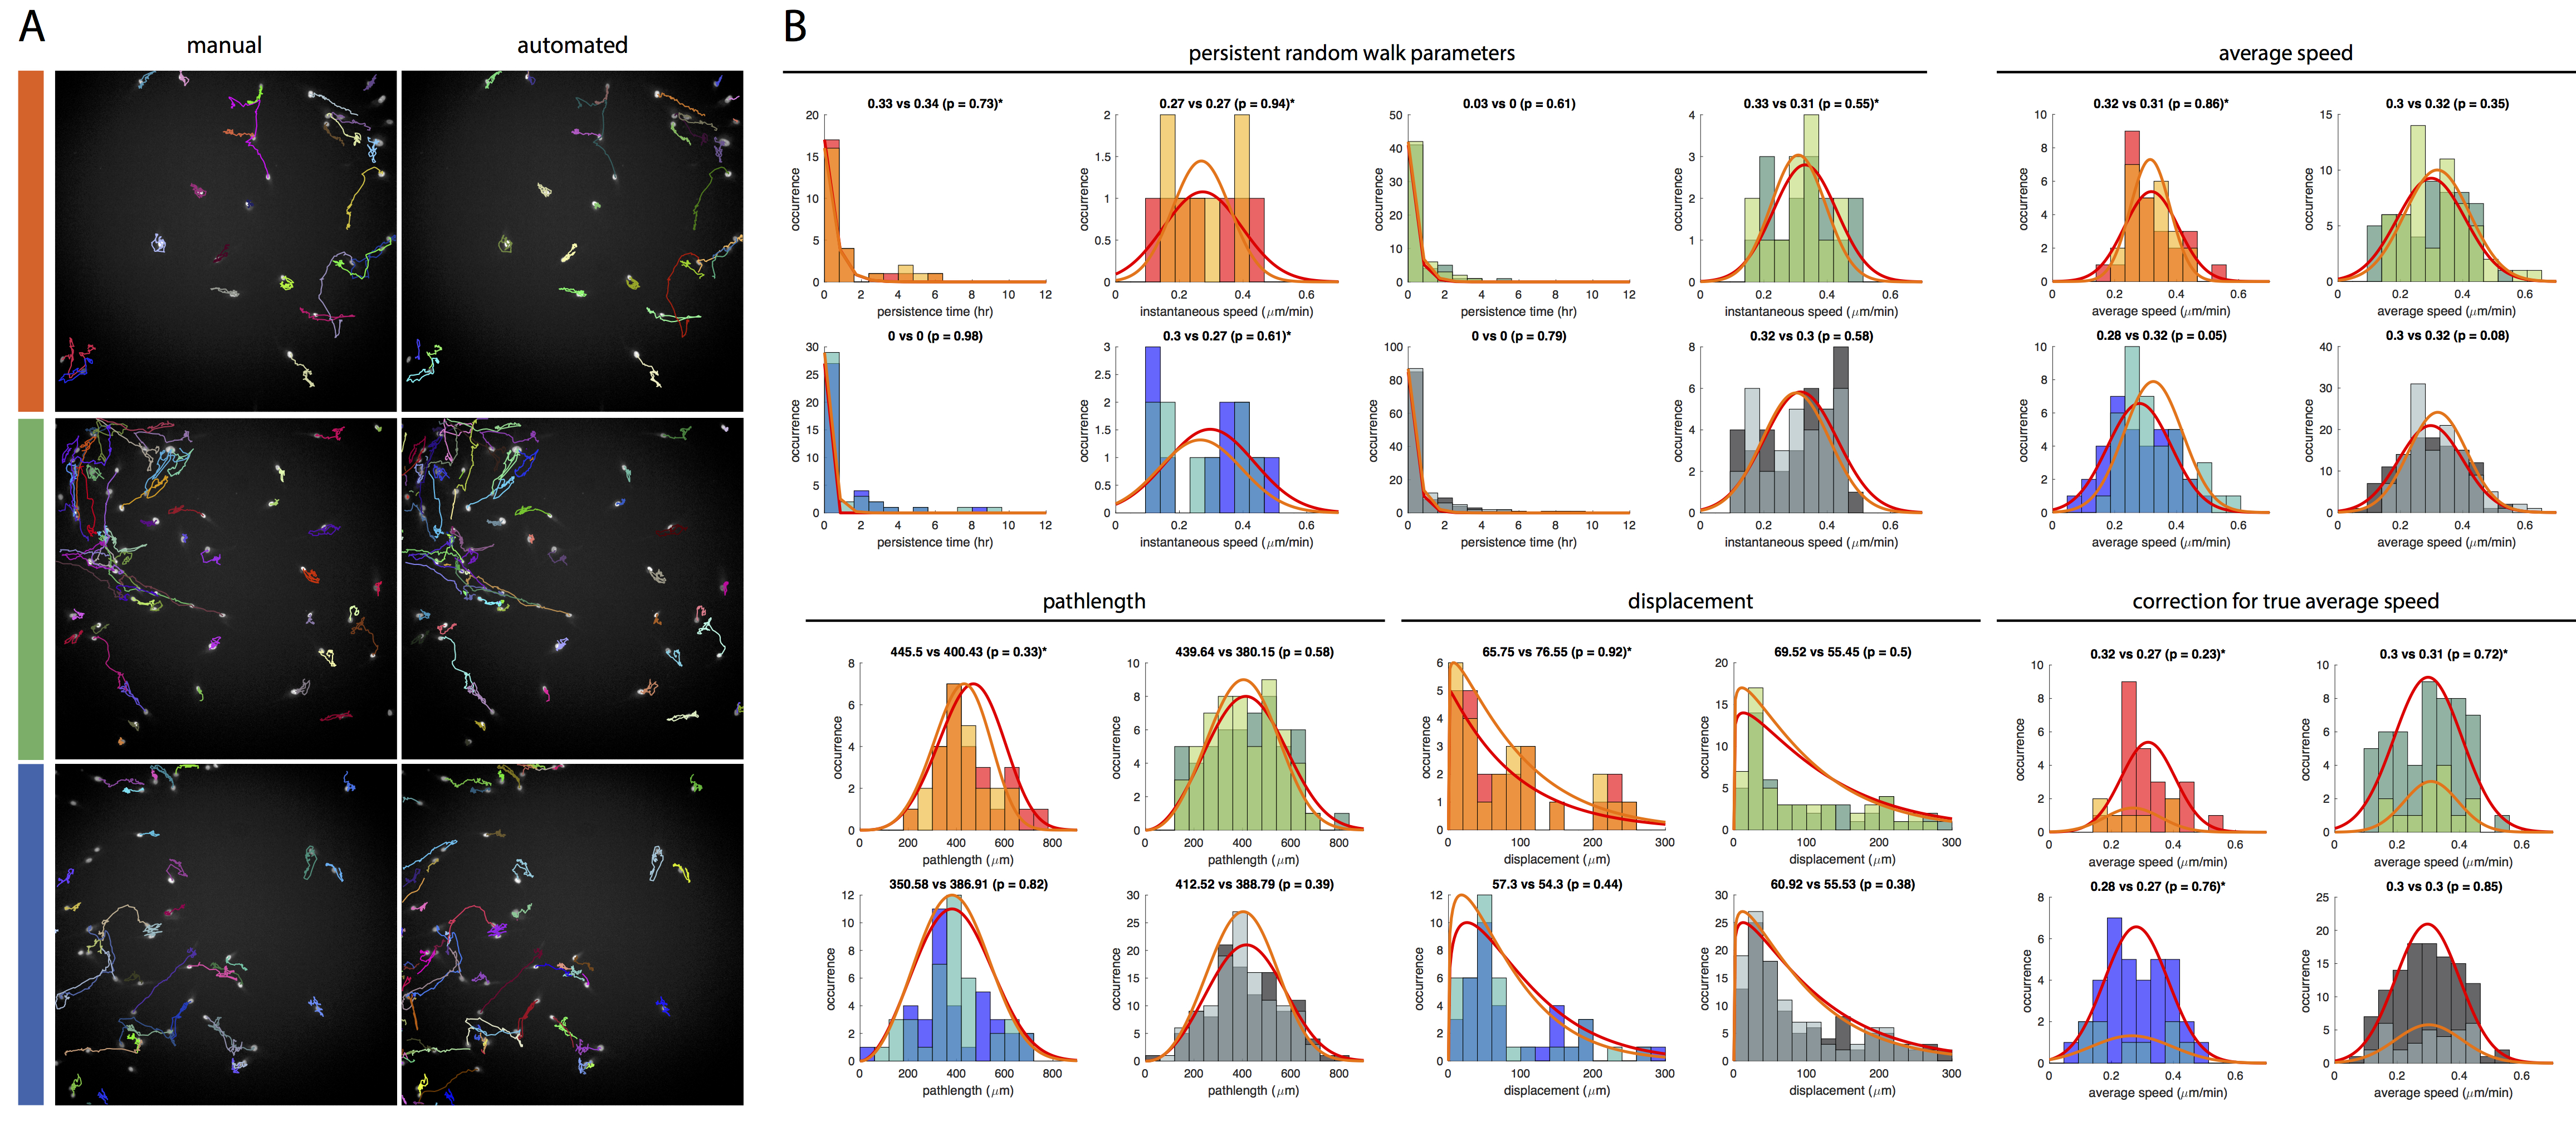
A. Representative cell tracking from three independent migration experiments, color-coded by the color bars to the left in red, green, and blue. B. Distributions of motility parameters (persistence time, instantaneous speed, average speed, pathlength, and displacement) obtained from the manual (darker colors) and the automated tracking (lighter colors). To boost the total number of cells for a better statistical rigor, data from the three migration experiments were combined to form a larger data set (color-coded in black). The first and the second number in the title of each histogram denote the median/mean value obtained from the manual and the automated tracking, respectively. An asterisk will appear in the title if the cell number falls below 30. The similarity of the cell tracks in (A) and the distribution of the different motility parameters in (B) suggest that the automated tracking is matching well with the manual tracking. Interestingly, the mean instantaneous speed from the automated tracking matched very well to mean average speed from the manual tracking, and may be used to better estimate the mean value of true average cell speed. Note that the persistence time and the instantaneous speed were calculated by taking the least squares regression of the mean squared displacements (MSDs) at different time scales in accordance to the persistent random walk (PRW) model. Since the PRW regression sometimes yield unrealistically high values of instantaneous speed, any cells with instantaneous speed > 2SD were considered as outliers and excluded from the analysis. For instantaneous speed and average speed, we assumed normal distribution and used student’s t-test (α = 0.05, two-tailed, without the assumption of equal variance) for the statistical comparison of the mean values. For persistence time, pathlength, and displacement, we did not assume normal distribution and used Mann-Whitney U-test for the statistical comparison of the data distribution. [HiRes Link: [Fig B] random migration manual vs auto]
migration during wound healing:
A. Manual vs automated cell tracking. Four independent wound healing migrations were analyzed and color coded by the color bars to the left in red, green, blue, and black. B. Distributions of motility parameters (persistence time, instantaneous speed, average speed, pathlength, and displacement) obtained from the manual (darker colors) and the automated tracking (lighter colors). The first and the second number in the title of each histogram denote the median/mean value obtained from the manual and the automated tracking, respectively. Due to high cell densities, the frequencies of cell collisions in the wound healing migrations were much higher compared to the random migration shown above. Consequently, the pathlength and the displacement obtained from the automated tracking tend to under represent the true values. This is also true but to a lesser extent for the average cell speed. However, the higher cell density also boosted the sample size of cells with r2 > 0.999 for the PRW model regression. Consequently, the persistence time and instantaneous speed obtained from the automated tracking tend to match well to the true values obtained from manual tracking. The the distribution of the instantaneous speed may be used to better assess the distribution of the true average speed. NOTE: Even after selecting only cells that conform to the PRW model with r2 > 0.999, the smallest sample was still > 80. [HiRes Link: [Fig B] WH manual vs auto]
Closer look at the performance of automated tracking in capturing the time progression of motility parameters:
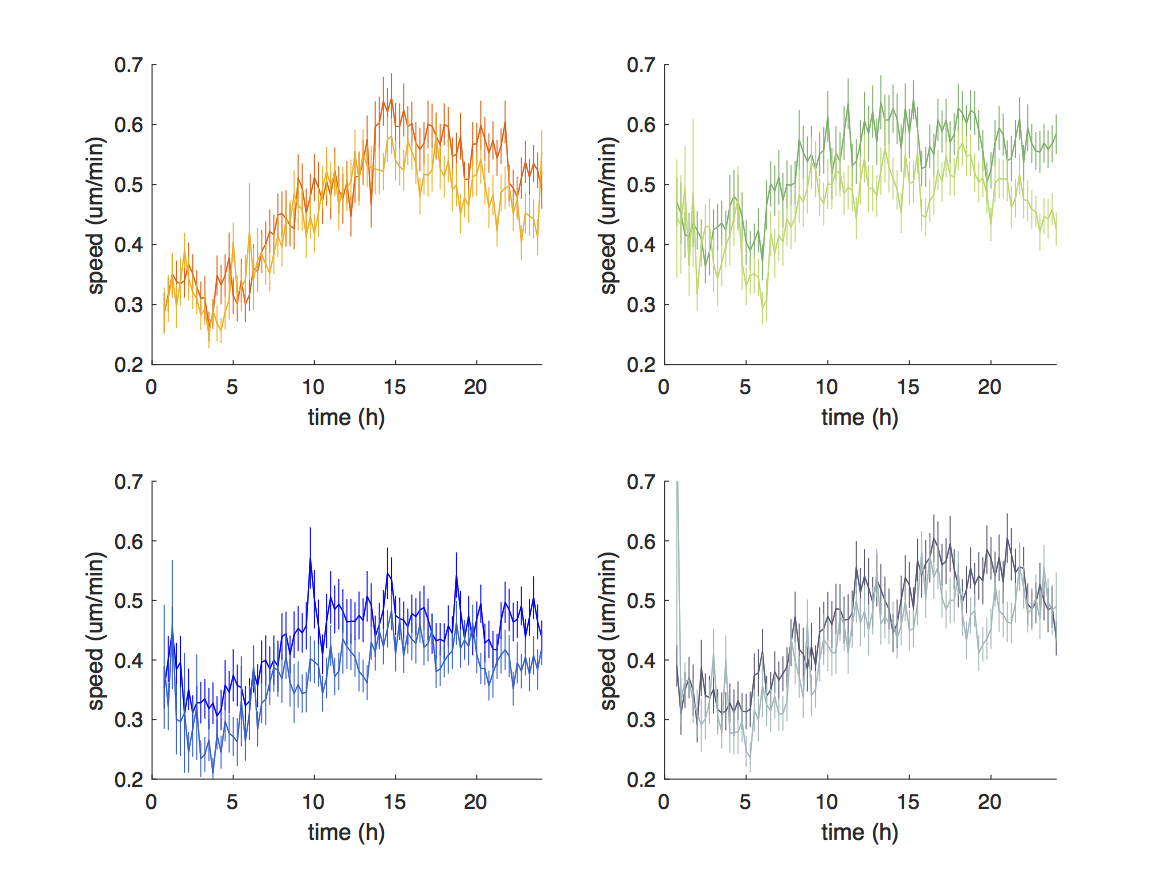 Automated tracking did a good job capturing the trend of cell speed progression over time. Consistent with the average cell speed data shown above, the speeds obtained from automated tracking slightly under represent the true cell speeds.
 For automated tracking, the angle autocorrelation (at a 15 min time scale), which describes the closeness of migration direction from one time point to the next, exhibits frequent sharp drops in values. This is due to frequent cell collisions from the high cell densities.
 However, if we examine the angle autocorrelation obtained from the automated tracking at the longer scales, the artifacts due to cell collisions became much mitigated. In most cases, the automated tracking managed to capture the trend of true angle autocorrelation (at time scales >2.5 hr).