More separations using wafer # 1142 with 35 nm pores and 14% porosity
In our last post we showed that this latest wafer with 36 nm pores did a better job of blocking 20 nm NPs in the forward and reverse orientations, whereas an older wafer (1070- 45 nm, 15%) showed better separations in reverse orientation. Here is a couple plots summarizing the difference:
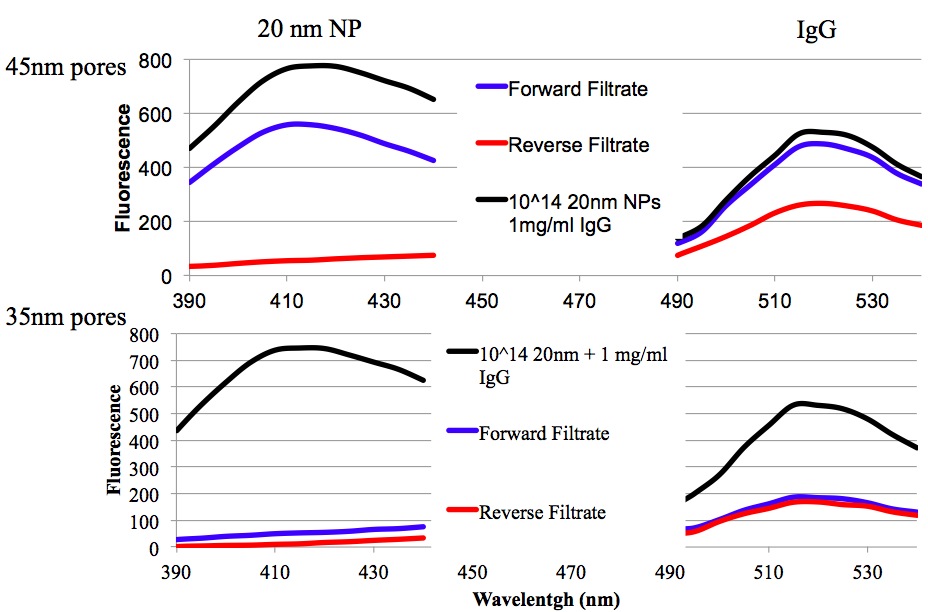
So 20 nm NPs are blocked no matter what. IgG is passing, but we are not seeing the same fluorescence as that of the beginning solution. So we did some separations of just IgG and just NPs to see if it’s just the pores that are restricting the IgG passage, or if it could be due to interaction with the particles. These were all done in the forward orientation.
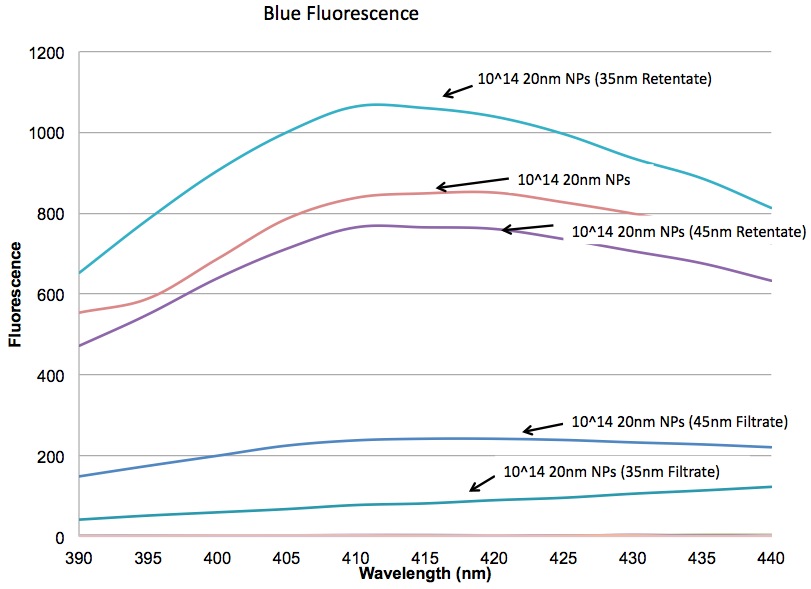
In this plot we see that a fraction of the 20 nm NPs are making it through the 45 nm pores and less are making it through the 35 nm pores.
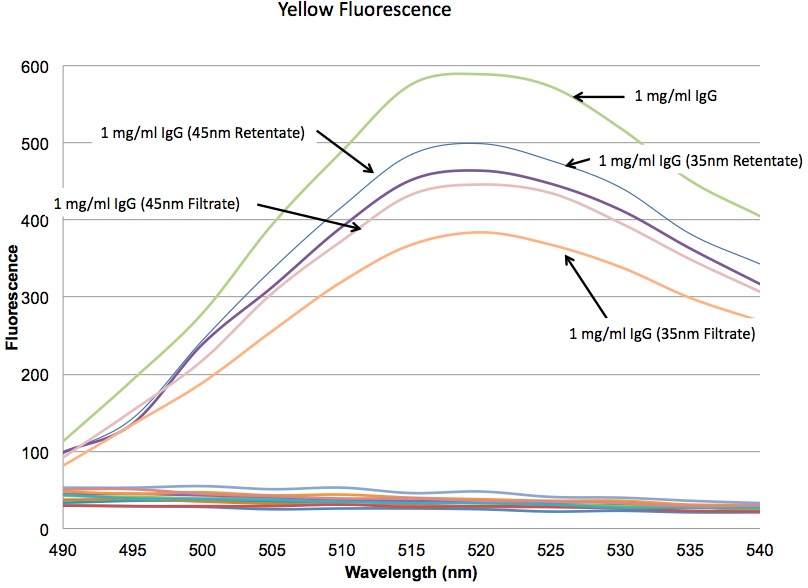
In this plot we see that IgG is passing through both 45 nm pores readily and they are passing slightly less readily through the 35 nm pores. Because it passes so readily through these pores, my assumption is that we are getting reduced fluorescence in the filtrate because a significant fraction of the IgG is being bound to the 20 nm NPs.
Something to keep in mind for all of these tests: The solutions are being diluted by buffer on both the top and bottom which is why the filtrate and/or retentate typically have a lower fluorescence than the starting solution.
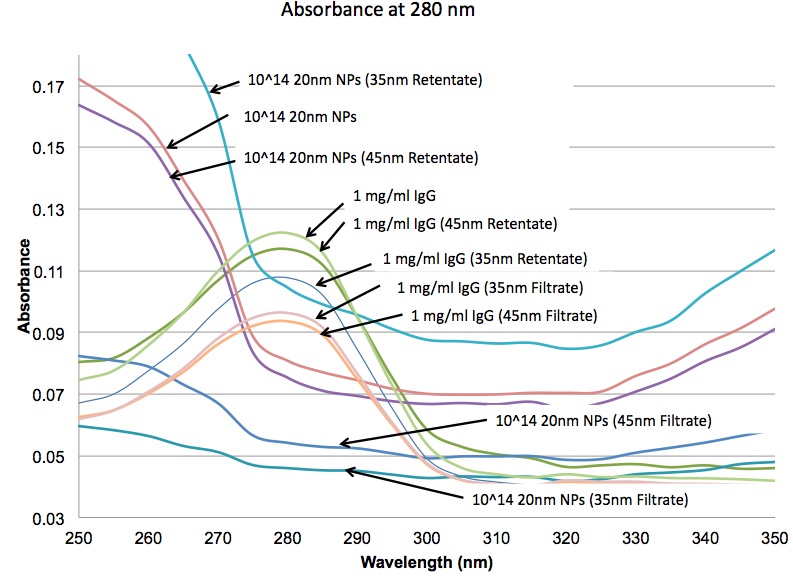
Finally, for completeness, we looked at absorbance: It’s messy, but it confirms what we saw in fluorescence.
My next efforts will be to summarize all of the information we have thus far on these NP/IgG separations for our own understanding and for publication.