Cell Morphology and Neutrophil Transmigration on Microporous-NPN
Introduction
Since development, much μ-NPN work has been focused on observing cell adherence under flow, cell morphology on deferentially spaced pores, and neutrophil transmigration. This post will detail the entirety of my work with these membranes to date, and plans going forward.
Previous Membranes
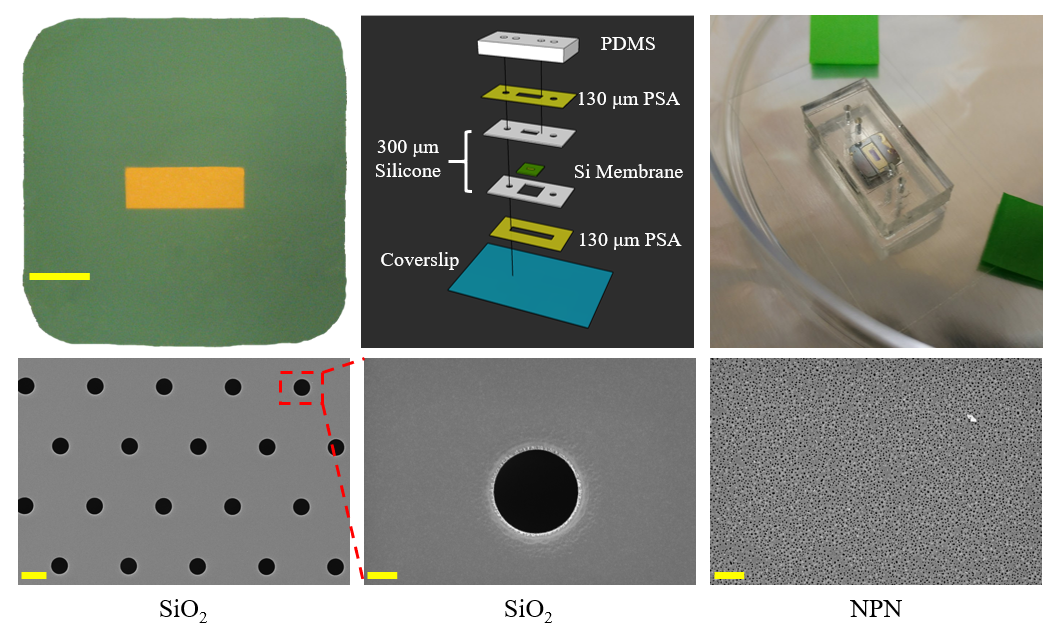
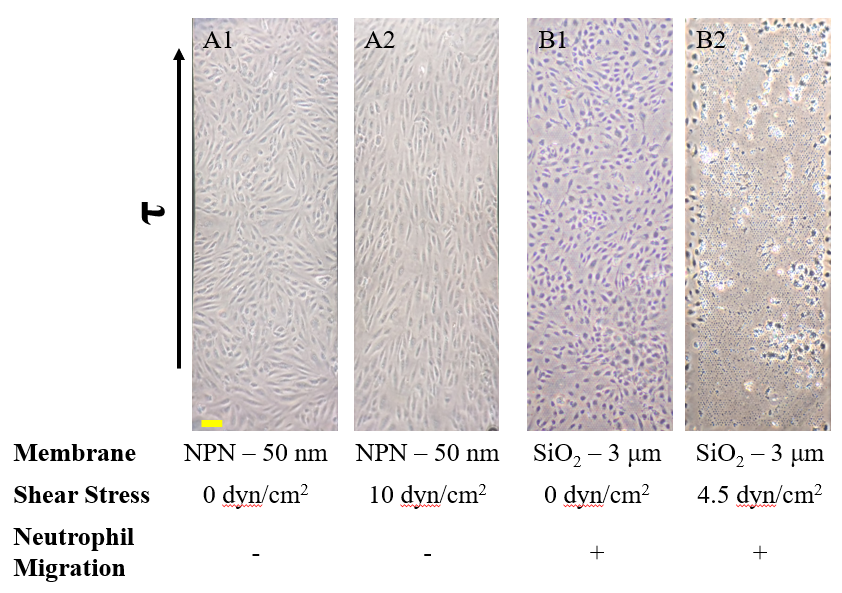
Prior to μ-NPN development, we worked primarily with the microporous SiO2 and NPN. Devices were made as usual, with the addition of pressure sensitive adhesive layers to allow for the addition of gels if needed, as well as for easy disassembly for SEM (Figure 1). While both microporous SiO2 and NPN provided excellent phase imaging contrast and cell culture compatibility, problems with cell adherence (SiO2) and the desire for 3D migration (NPN pores <50 nm) hindered our ability to fully model the microvasculature. This lead to the need for a membrane solution that addressed all of our needs going forward.
μ-NPN Development and Cell Culture
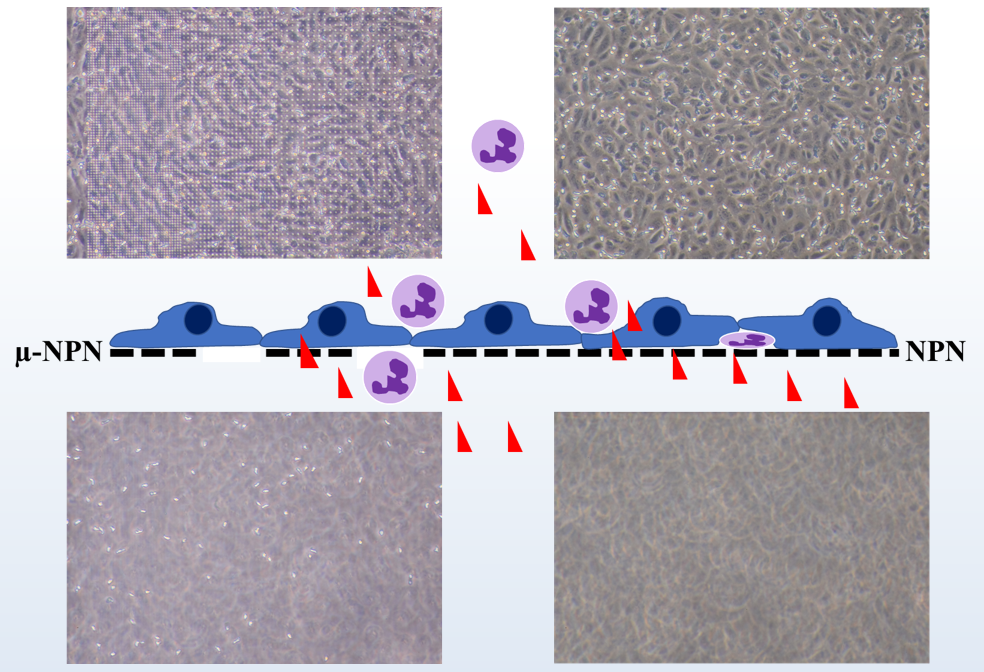
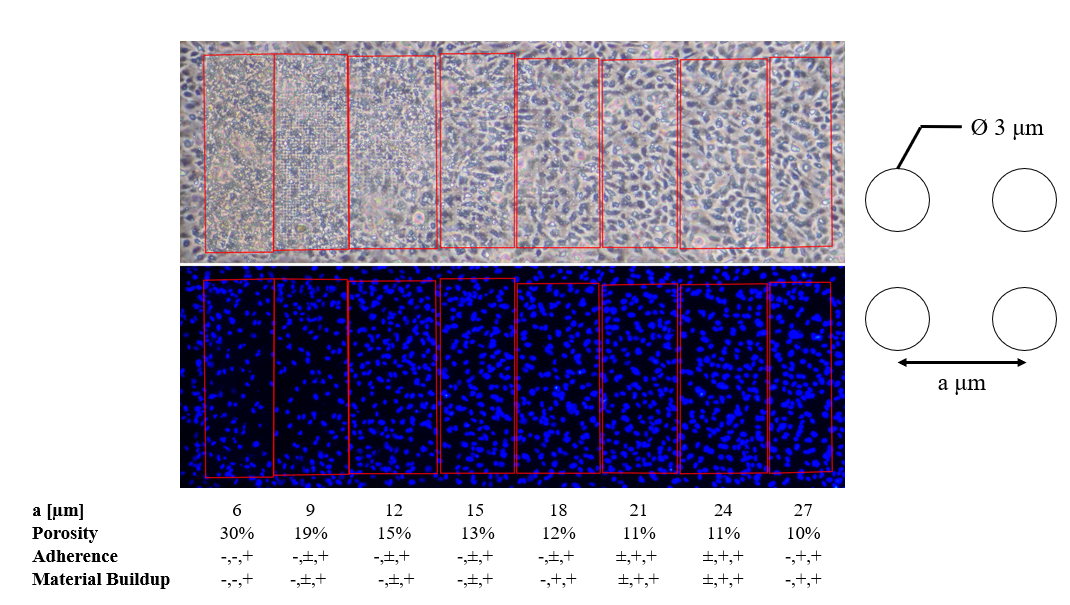
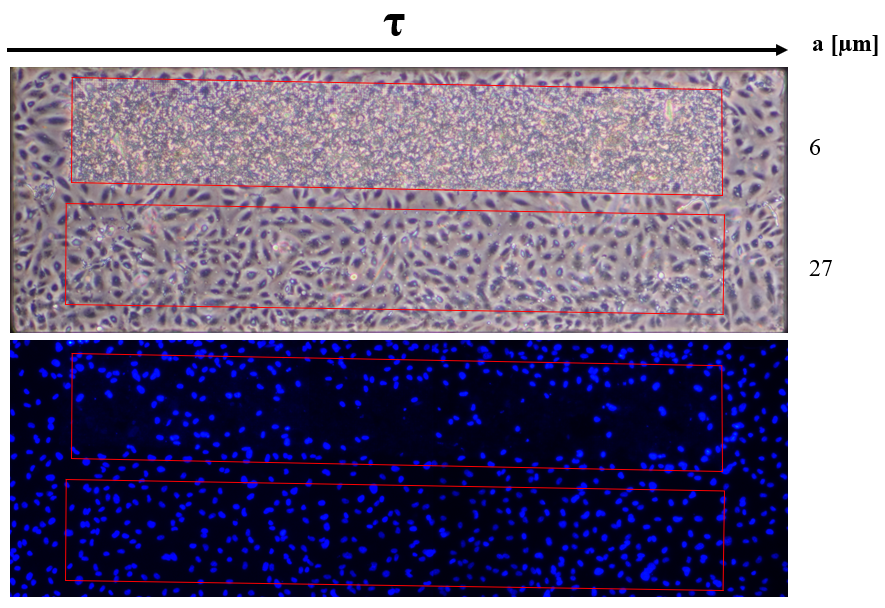
The μ-NPN fabrication process was detailed in a previous post, a schematic of the process can be seen in Figure 3. HUVECs seeded on μ-NPN membranes with a gradient of pore spacings were sheared and observed in phase and under fluorescence with a DAPI stain. Region porosities of 30, 19, 15, 13, and 12 percent all showed cell loss and uncharacterized material buildup. Interestingly, with the DAPI stain, it appears that cell loss is primarily present in the 30 and 19 percent porosity regions, but minimal to non-existent in the other regions (Figure 4). To further investigate the presence of the material buildup, a membrane with high (30) and low (10) porosity regions spanning the length of the membrane was developed. HUVECs were seeded and sheared on the side by side membranes following the standard protocol (24 h static, 24 h shear). A DAPI counterstain was used to observe the presence of cells under the material buildup. As expected, material buildup completely blanketed the high porosity region (Figure 5). The fluorescent stain revealed significant cell loss as well. Following these experiments, I hypothesized that the material buildup was due to cell lysis and a positive transmembrane pressure forcing said material into the more porous membrane regions. To rescue this, I blocked off potential transmembrane pressure issues by plugging the backside with a collagen gel. The gel plug prevented material buildup (Figure 6). One interesting observation is the change in cell morphology seen on the different porosity regions. The cells appear to take on a more rounded morphology on the higher porosity regions, that steadily transitions to a spread morphology on the lower porosity and plain NPN regions.


Neutrophil 3D Migration on μ-NPN and NPN
The last proof of concept experiment we outlined for the μ-NPN membranes we a real time observation of neutrophil egress. HUVECs were seeded on NPN and μ-NPN membranes and grown to confluency (roughly 24 h). Human neutrophils were isolated from subject whole blood on the morning of the transmigration experiment. Neutrophil isolation is performed based on a one-step polymorph seperation media with red cell lysis and cell cleaning. The result is an extremely homogeneous population of human neutrophils. Neutrophils were added to MCDB-131 complete HUVEC culture media at a density of 3 million cells/mL and immediately introduced to the top channel of the microvasculature mimetic. fmlp in MCDB-131 was added to the bottom channel and time lapse imaging was initiated.