Protein Binding by Suspended Graphene Oxide
Experiments were conducted to determine how effectively protein is bound by suspended graphene oxide (GO) particles. This is important for our application because we hope to use GO as a membrane to bind toxins present in blood.
BSA (bovine serum albumin) was used as the test protein. Test samples consisted of a mixture of BSA and GO. After incubation, samples were spun down using a centrifuge. At these concentrations of GO, a visible pellet is formed consisting of the GO and any protein that has bound to it. Any protein that did not bind with GO will remain in the supernatant. Thus, we collected the top 70 uL of each supernatant to determine how much protein remained unbound. Each sample was placed in a cuvette and analyzed in a Tecan spectrophotometer to find the absorbance at 280 nm, the optimal wavelength for protein. A BSA calibration curve was created to convert from absorbance to BSA concentration. This was then subtracted from the original concentration of BSA to determine the amount of protein that bound to GO. We expected the concentration of bound protein to increase as the GO concentration increased.
Test samples were created by mixing a 3 mg/mL stock of BSA with varying GO stocks (these started at 3 mg/mL and were serially diluted 1:2, with the lowest concentration being 0.1875 mg/mL). Each GO stock was mixed with BSA 3:1, resulting in a constant BSA concentration of 1 mg/mL and GO concentrations of 2 mg/mL, 1 mg/mL, 500 ug/mL, 250 ug/mL, and 125 ug/mL. BSA standards, which were used to plot the BSA calibration curve, consisted of serial dilutions of BSA in PBS. A GO calibration curve was also created, though at much lower concentrations (the highest is 250 ug/mL). Finally, three controls of GO mixed with PBS (with GO concentrations at 1 mg/mL, 500 ug/mL, and 250 ug/mL) were spun down with the test samples in order to confirm that the presence of GO was not affecting the absorbance reading.
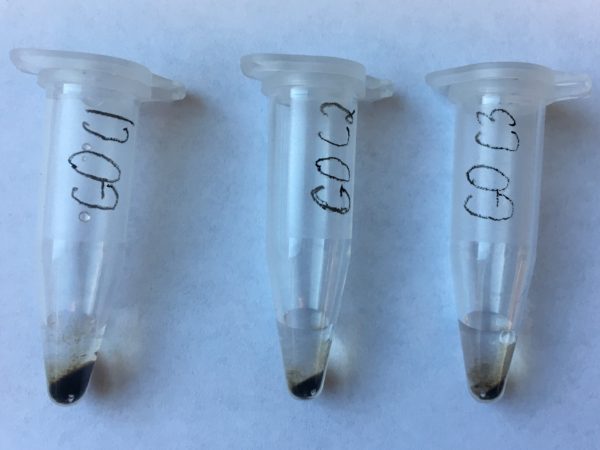
Samples incubated at room temperature for 1 hour. At this point, the test samples and GO control samples were centrifuged at 12,000g for 10 minutes. As expected, GO pellets formed for all of the samples (fig. 1-2). At larger concentrations, GO predictably forms larger pellets.

The top 70 uL of each sample was analyzed using the Tecan spectrophotometer. Calculations, as described earlier, were carried out to find the concentration of protein that bound to GO in each sample. The equation used to convert from absorbance to BSA concentration is seen in fig. 3.

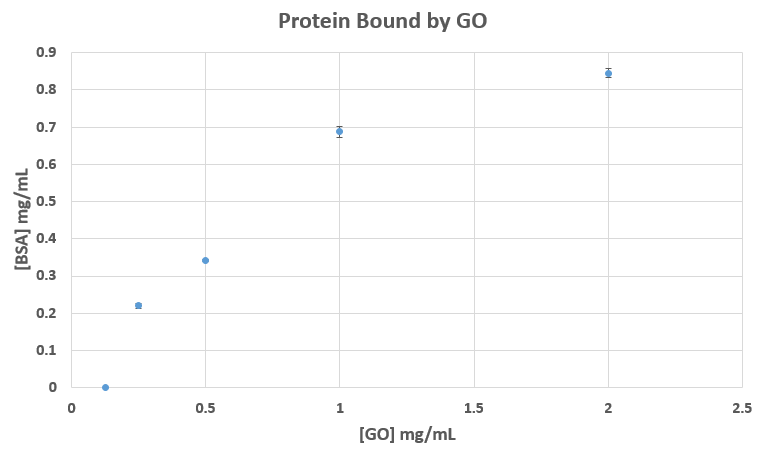
As expected, higher concentrations of GO bound higher concentrations of BSA (fig. 4). There are large increases in protein concentration from 250 ug/mL to 1 mg/mL GO. The data appears to be tapering off as we reach the highest concentration of 2 mg/mL GO.
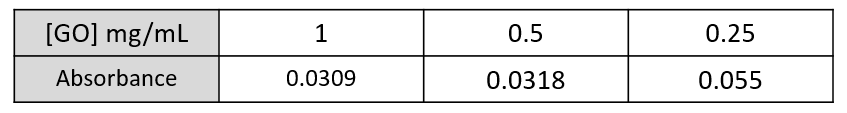
Results from the three GO control samples show that, as the concentration of GO decreases, the absorbance increases (table 1). This indicates that we are within the error range of the Tecan spectrophotometer, as higher concentrations should essentially have a higher absorbance. From this we concluded that the presence of GO in the samples was not contributing to the absorbance of our test samples.
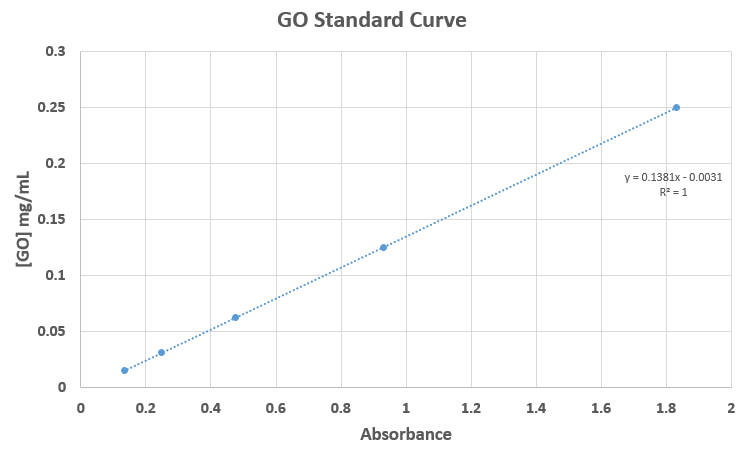
A GO calibration curve was created to appreciate how easily GO is detected at this wavelength (fig. 5). The absorbance at 250 ug/mL of GO is 5 times larger than that of the 2 mg/mL BSA standard. The spectrophotometer cannot even read the absorbance at a GO concentration of 500 ug/mL, let alone 2 mg/mL. This underlines why it is important to pellet the GO, as the GO would, by far, be the main influence in the absorbance reading otherwise.
In conclusion, our experiment was successful. We found that, as the concentration of GO increases, the concentration of protein bound to this GO also increases. GO can effectively bind protein.
You should repeat Figure 4 after the GO has been sonicated to break up any aggregate.