[Rotation] Polarized TNFalpha TEER
Introduction
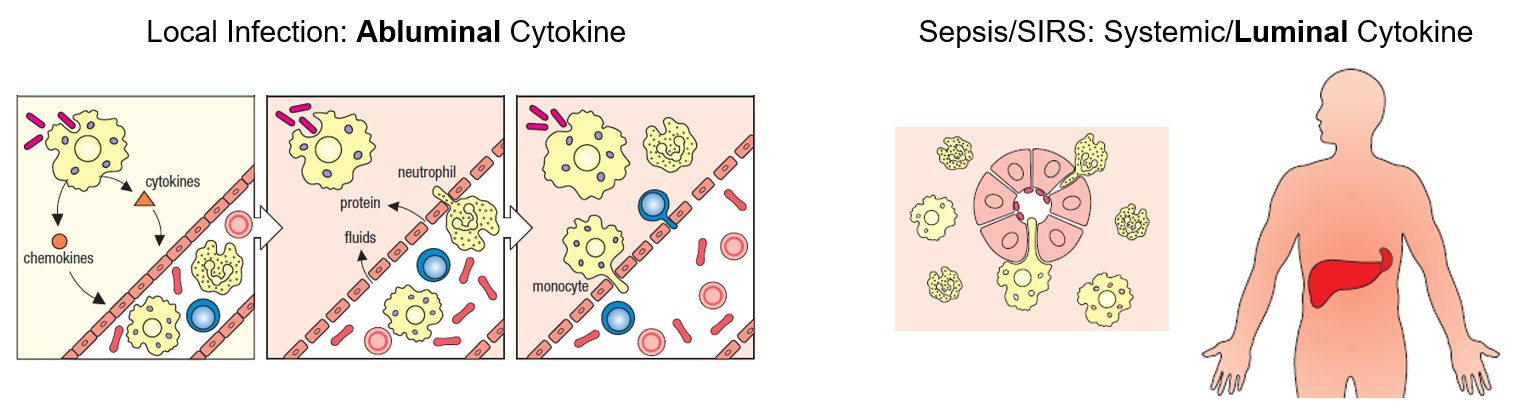
Briefly, we are looking at the potential effects polarized delivery of TNF-α might have on various aspects of the microvascular endothelium and the neutrophil based innate immune response. The rationale behind this study is past sepsis (a life-threatening organ dysfunction caused by a dysregulated host response to infection) therapeutics may all together block your immune systems function in the case of local infection. One key aspect differentiating sepsis from local infection is the way inflammatory cytokines are presented. In local infections, tissue residing macrophages secrete TNF-α in response to a pathogen. In sepsis, TNF-α is delivered systemically throughout the vasculature (Figure 1). All together, we hope to observe differences in the innate immune response to this polarized TNF-α, and inform sepsis therapeutics going forward. In this post, we are going to focus on transendothelial electrical resistance (TEER).
Materials and Methods
EVOM2 with STX2 (Chopstick Method)
Coat Transwell inserts with 11.2 μg/mL fibronectin and sit in incubator for 1 hr. Prepare cells for seeding at 50,000 cells/cm2. Remove fibronectin, rinse with fresh cell media, discard. Add 1.5 mL media to the bottom well and add 0.5 mL cell suspension to transwells. Incubate at 37°C, 5% CO2 for 24 hours.
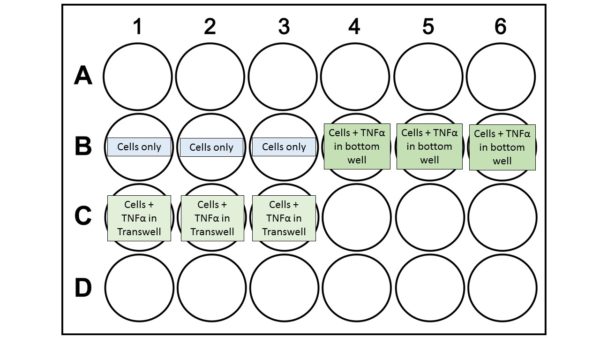
Replace old media with fresh media. Take 0 hour TEER measurements using STX2 chopsticks following instruction manual. Take three technical replicates for each well. Replace media with 20 ng/mL TNF-α in media in proper wells:

Take additional TEER measurements at 4 and 24 hours. When calculating resistance, average the three technical replicates and subtract background measurements for each time point. Calculate TEER values in Ohm-cm2 by normalizing to transwell surface area.
EVOM2 with EndOhm-6 (Cup Method)
This method is very similar to the chopstick method, however, some modifications were made to improve the assay and to adjust for 24 well sizes. The changes are in red.
Coat Transwell inserts with 11.2 μg/mL fibronectin and sit in incubator for 1 hr. Prepare cells for seeding at 60,000 cells/cm2. Remove fibronectin, rinse with fresh cell media, discard. Add 0.6 mL media to the bottom well and 0.1 mL media to transwell insert. Take a background TEER readings for each well, using EndOhm-6, following instruction manual. Remove media from transwell and add 0.1 mL cell suspension to transwells. Incubate at 37°C, 5% CO2 for 48 hours, replacing the media after 24 hours.
Replace old media with fresh media. Take 0 hour TEER readings using EndOhm-6. Replace media with 20 ng/mL TNF-α in media in proper wells:
Take additional TEER measurements at 4 and 24 hours. When calculating resistance subtract background measurements for each well. Calculate TEER values in Ohm-cm2 by normalizing to transwell surface area.
Results
One issue with using transwells is the inability to visualize your cells during an experiment. To confirm confluent monolayers, cells from the cup method experiment were fixed, critical point dried and imaged via SEM. For the most part, the monolayers looked intact for all groups. We did see what appears to be protein deposits in greater amount in the luminally-treated TNF-α group (see arrows). These experiments can be compared to VE-cadherin staining in Alec’s TNF-α experiments using NPN microchip devices. The advantage of using TEER in a transwell system is the ability to quantify changes in resistance, which cannot be done with the cell-cell junction imaging.

The TEER data was analyzed by a couple different methods. In all cases, background was subtracted and resistance values were normalized to the area of the area of the transwell. This is plotted on the left-hand side. Because each well had different resistance measurements for the 0 hour time point, we also normalized the data to each well, dividing all resistance values by its well’s 0 hr measurement. This is plotted on the right-hand side.

There is a consistent trend observed with decreased resistance at 24 hours with TNF-α treatment. Using an unpaired, two-tail student’s t-test, not assuming equal variance, there is a significant decrease in resistance at 24 hours in the luminally-treated TNF-α group compared to control when the data is not normalized to its individual well (however, I believe normalizing to individual well is a more accurate representation of the data). None of the other data points were significantly different. Although there was no further significance, it appears there may be a greater effect from luminally-treated TNF-α compared to abluminally-treated TNF-α. In the chopstick method, there was one abluminal well that was far lower than the others, which may be skewing that data down. Because this method is less reliable than the cup method, however, it would be good to repeat this experiment one more time with the cup method to confirm these findings.
Conclusions
Although TEER is a widely used, quantitative tool to look at changes in membrane resistance, this method does pose some questions in regard to reliability, particularly when using the chopstick method. The values can vary based on temperature, media content, volume in transwells, etc. Nevertheless, the results from these experiments are promising, and add a bit to the story of TNF-α and its effect on endothelial barrier resistance. It would be useful to supplement these experiments with permeability assays, to further tease out how polarized TNF-α may play a role in the innate immune response in regards to local infection versus sepsis.