Parylene Treatment Effect on Membrane Burst Pressure and Permeance
Introduction & Background
Parylene is a polymer stemming from the chemical-vapor-deposited poly(p-xylylene) group. This polymer treatment is applied as a gas which allows complete and uniform coatings of substrates with even nanoscale features. Parylene treatment is widely used as it offers a chemically and biologically inert layer with excellent electrical properties, and additionally acts as a stable, protective barrier for substrates.
In the realm of our membranes, parylene treatment should theoretically provide a conformal coating that reinforces membranes without concerns of biological interference. Additionally, parylene deposition could provide better pore size control and thereby increase filtering capabilities. To study parylene treatment effects on microporous membranes (3-μm pores), burst pressure and permeance testing were completed, in both membrane orientations using nitrogen gas.
Methods
These tests have been carried out a number of times, and a detailed description of each component used can be found in “Introduction to the Membrane Flow Analysis Device for Gas (MFAD-G), QC Model”.
The following figure presents the experimental setup used for both burst pressure and permeance testing. The components used include the supply nitrogen gas, a digital manometer, the Omega rotameter, and the chip/membrane fixture.
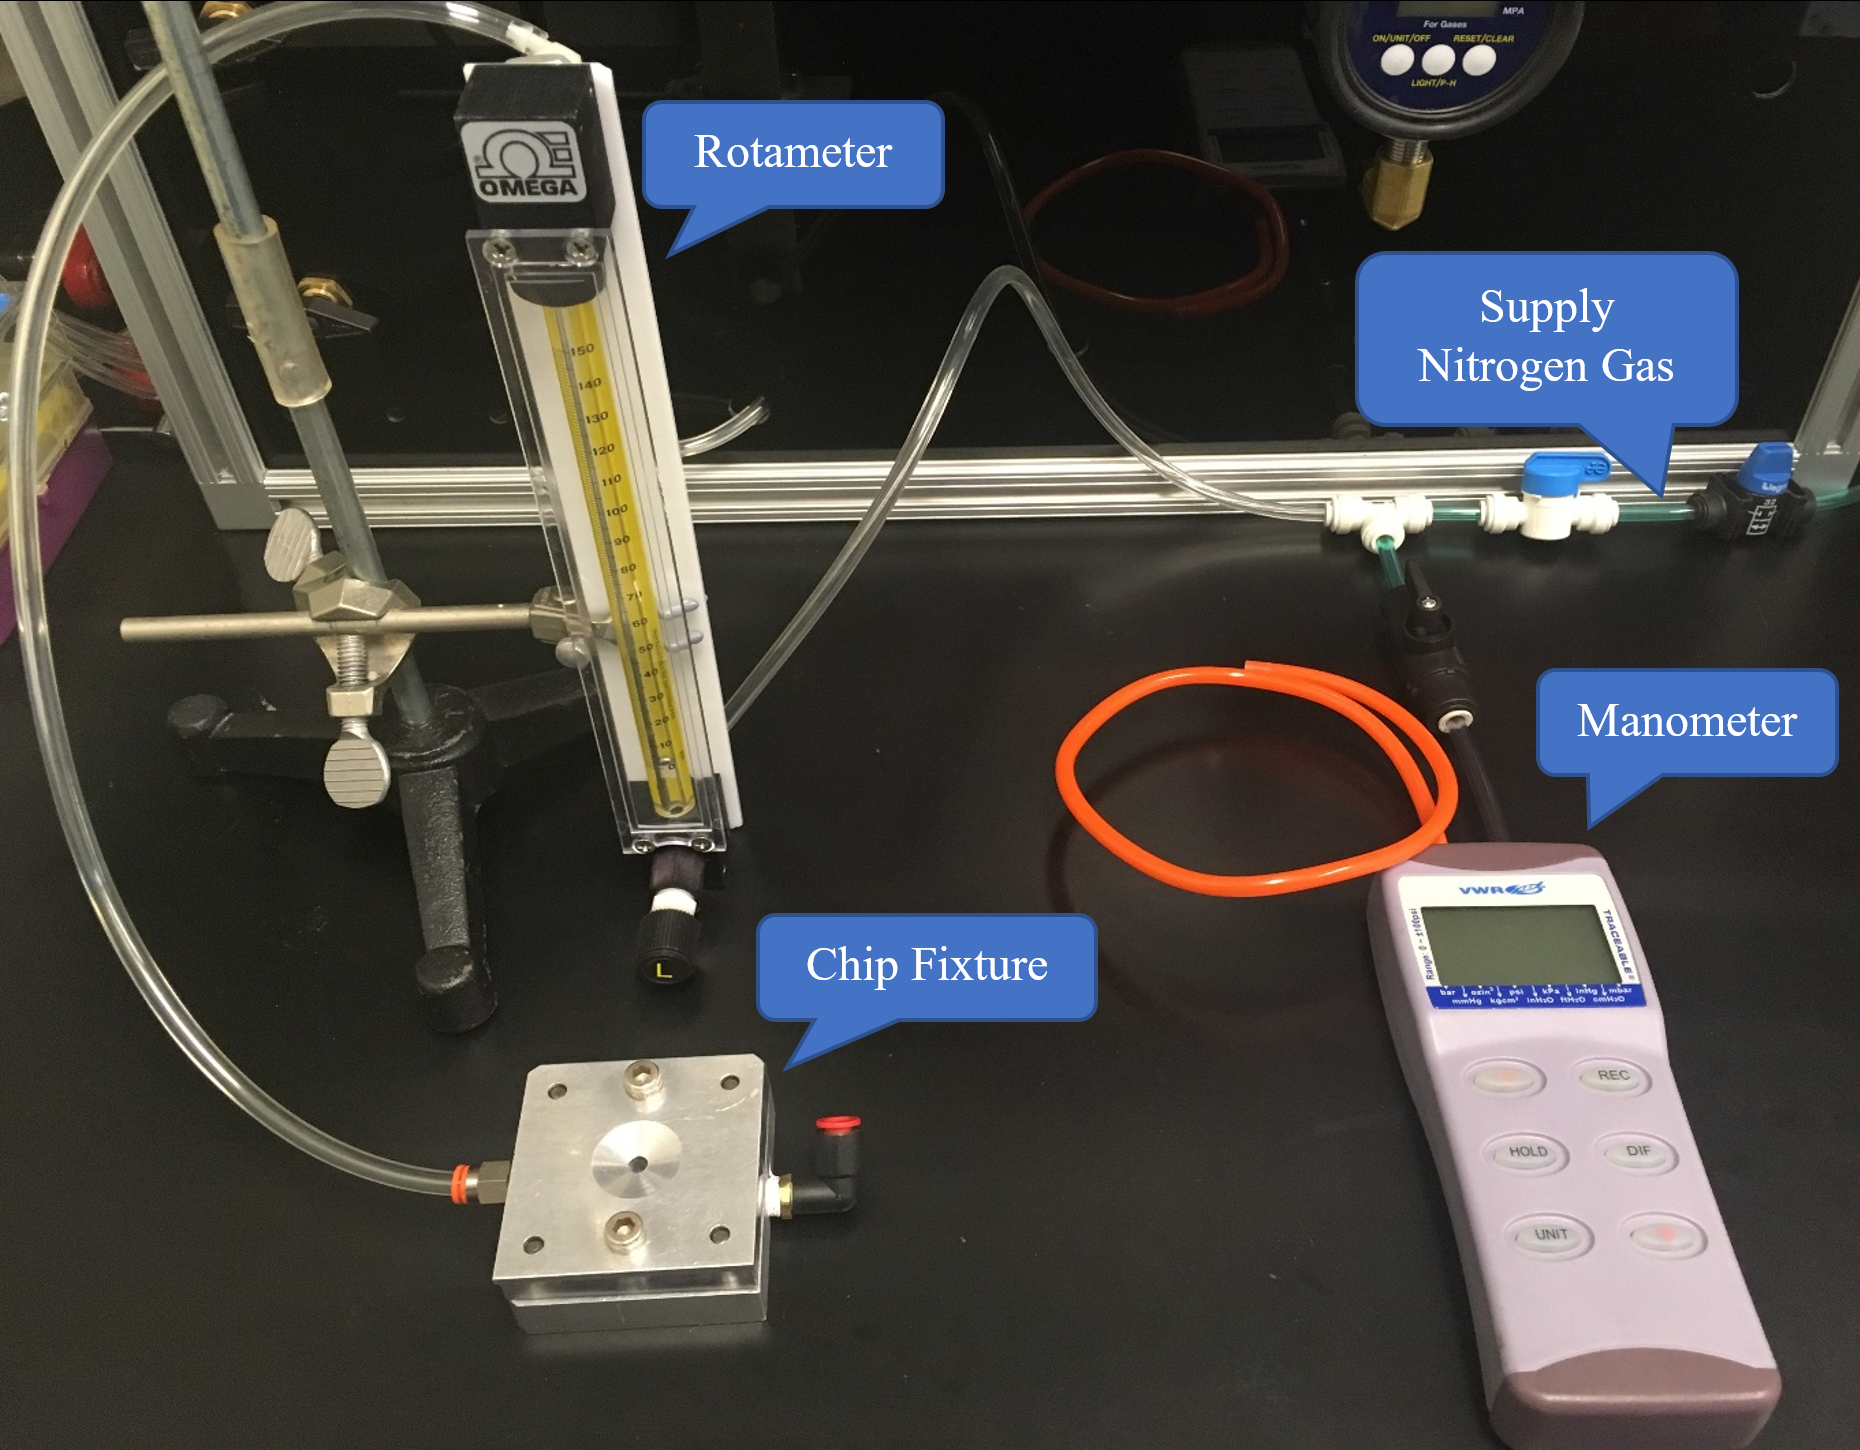
During burst pressure testing the supply pressure was slowly increased, at an approximate rate of 1 psi/minute, until the membrane broke, and the maximum pressure was recorded. Chips were tested in both orientations (trench-side up and trench-side down).
During permeance testing, the supply pressure was maintained at 0.4 psi, and the bead’s rise within the rotameter was recorded. These values were then used to calculate flow rate (ml/min) using the calibration curves found in “Permeance tests with new Omega rotameter”.
Results
To compare nanoporous burst pressure results with microporous, the following figure was referenced from “Burst Pressure: pnc-Si vs. NPN”.
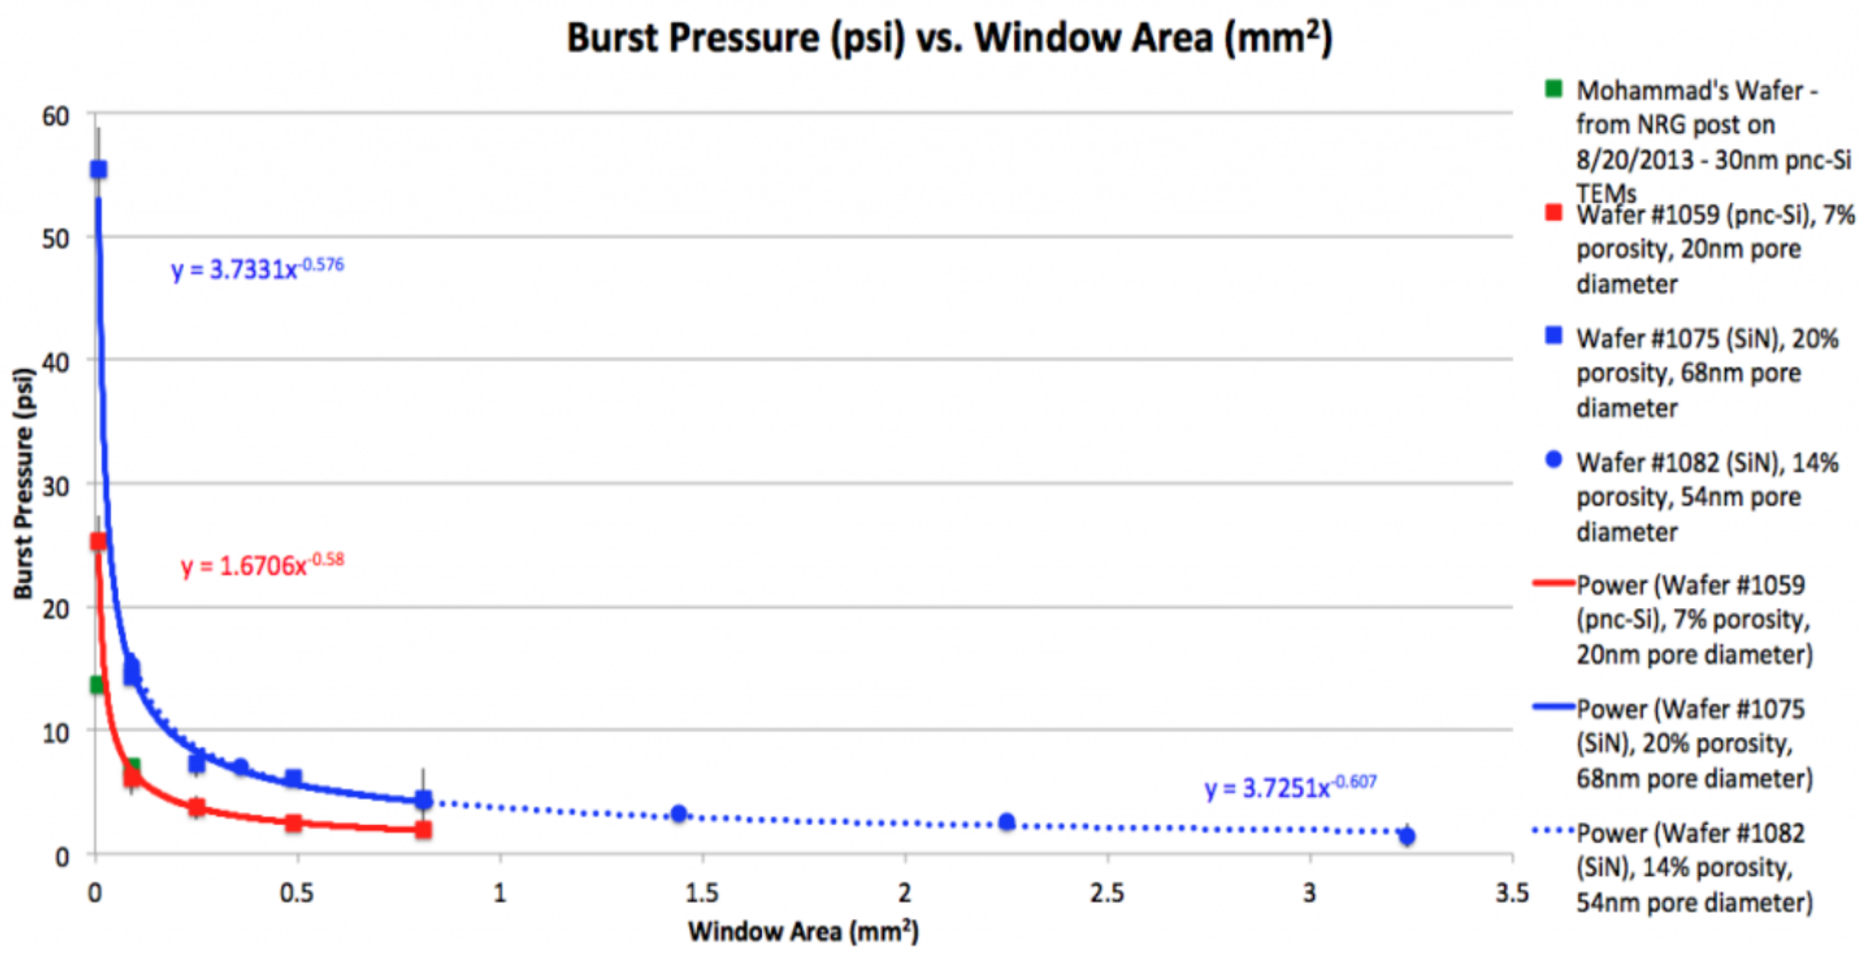
Using the provided trendlines, it is estimated that pnc-Si and NPN membranes with a window area of 1.4 mm2 (same as single-slot microporous membranes) would yield burst pressures of 1.37 psi and 3.04 psi, respectively. When tested in the trench-down orientation, untreated microporous membranes returned an average burst pressure of 9.04 psi. This means microporous membranes withstood a pressure roughly 6.6 and 3 times greater than nanoporous pnc-Si and NPN membranes with equivalent window areas, respectively.
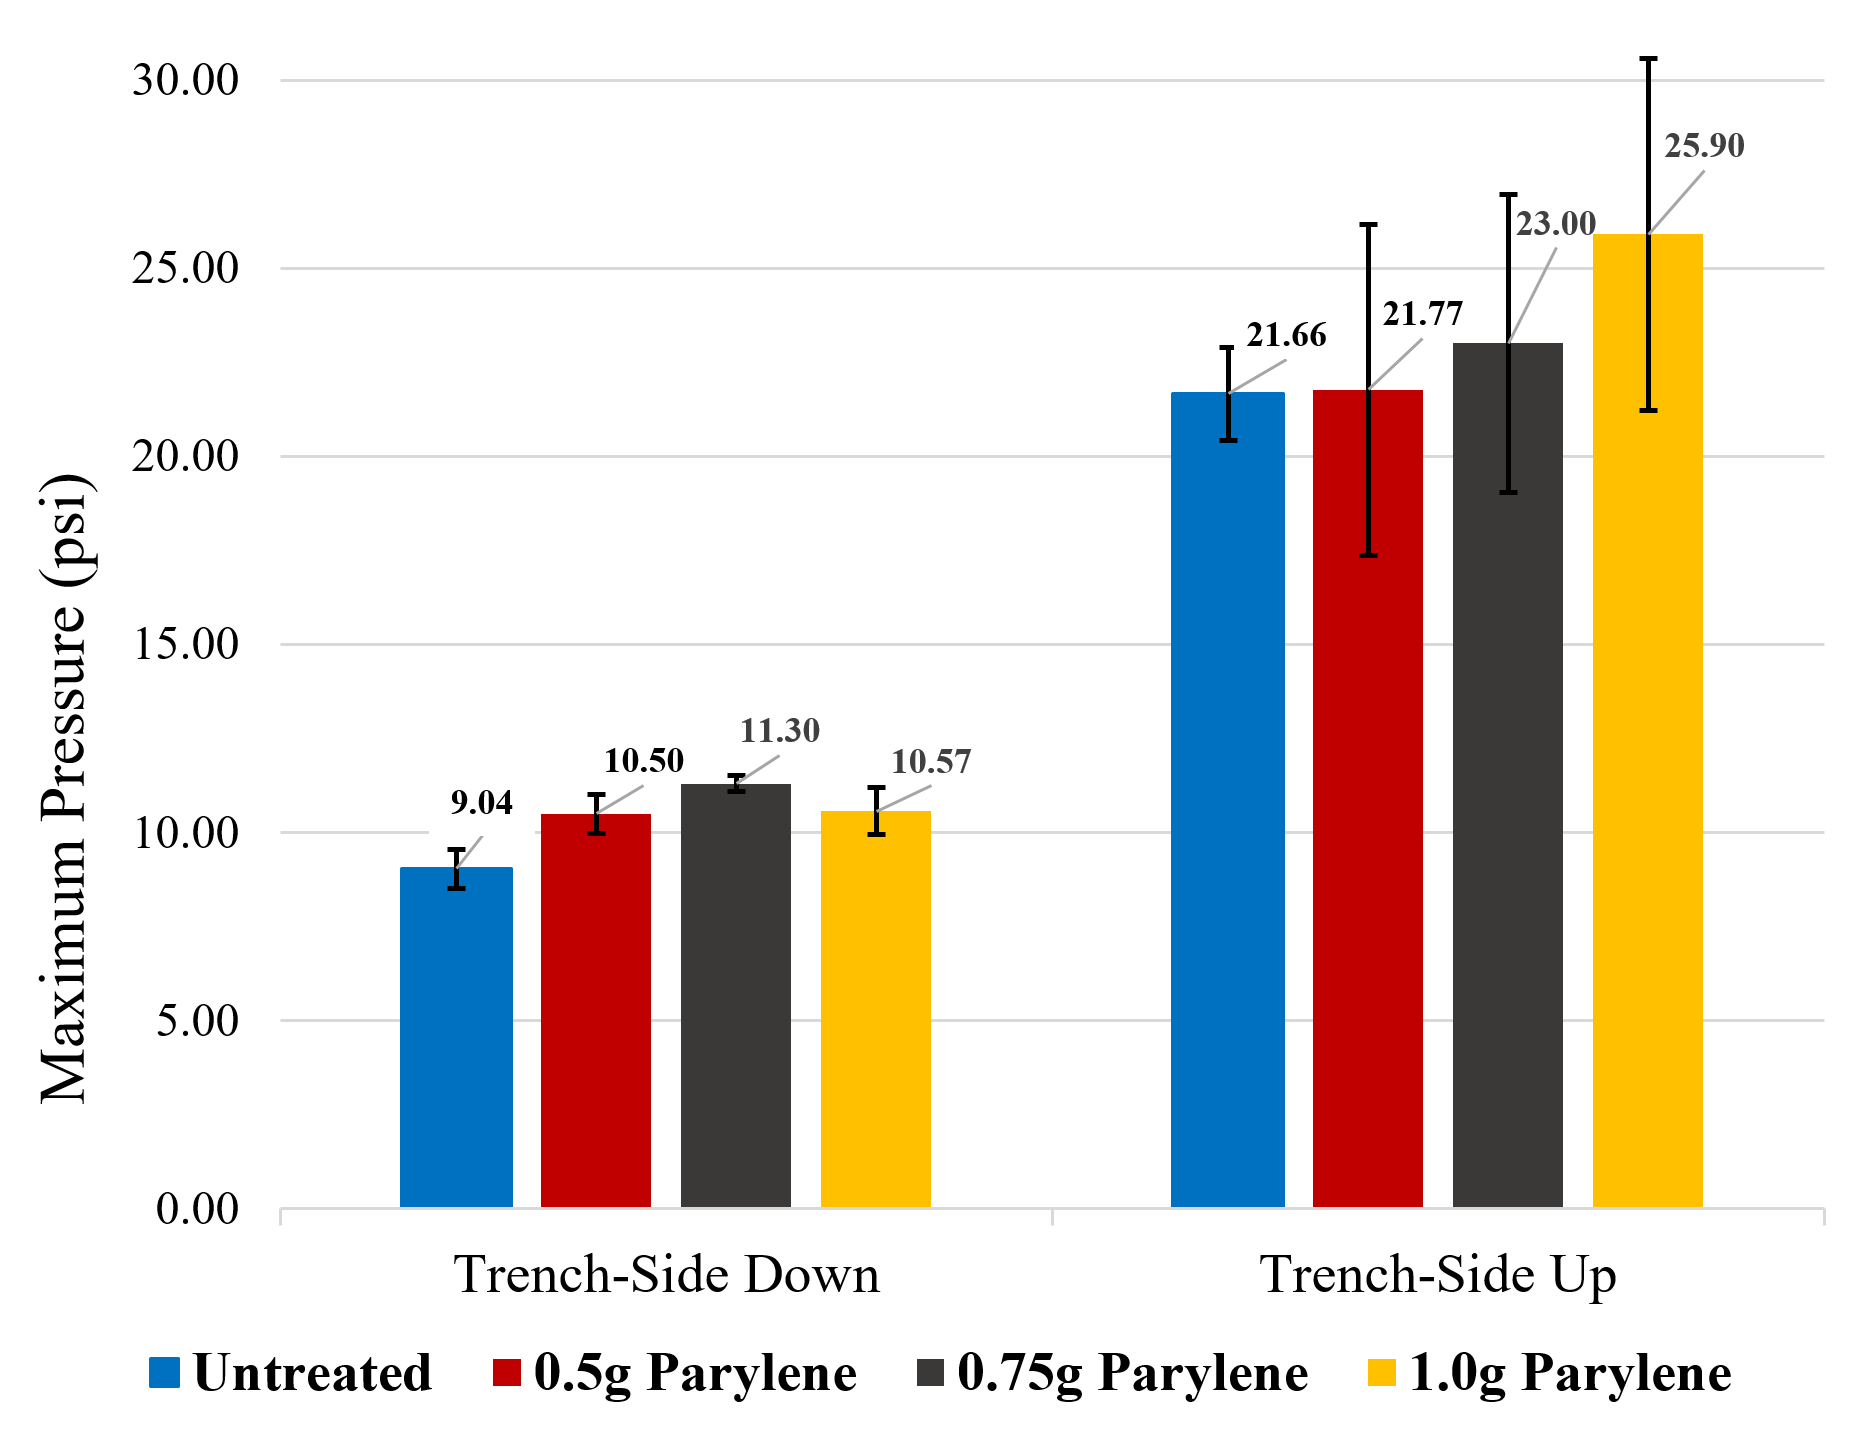
The comprehensive results from burst pressure testing are displayed in Figure 3.
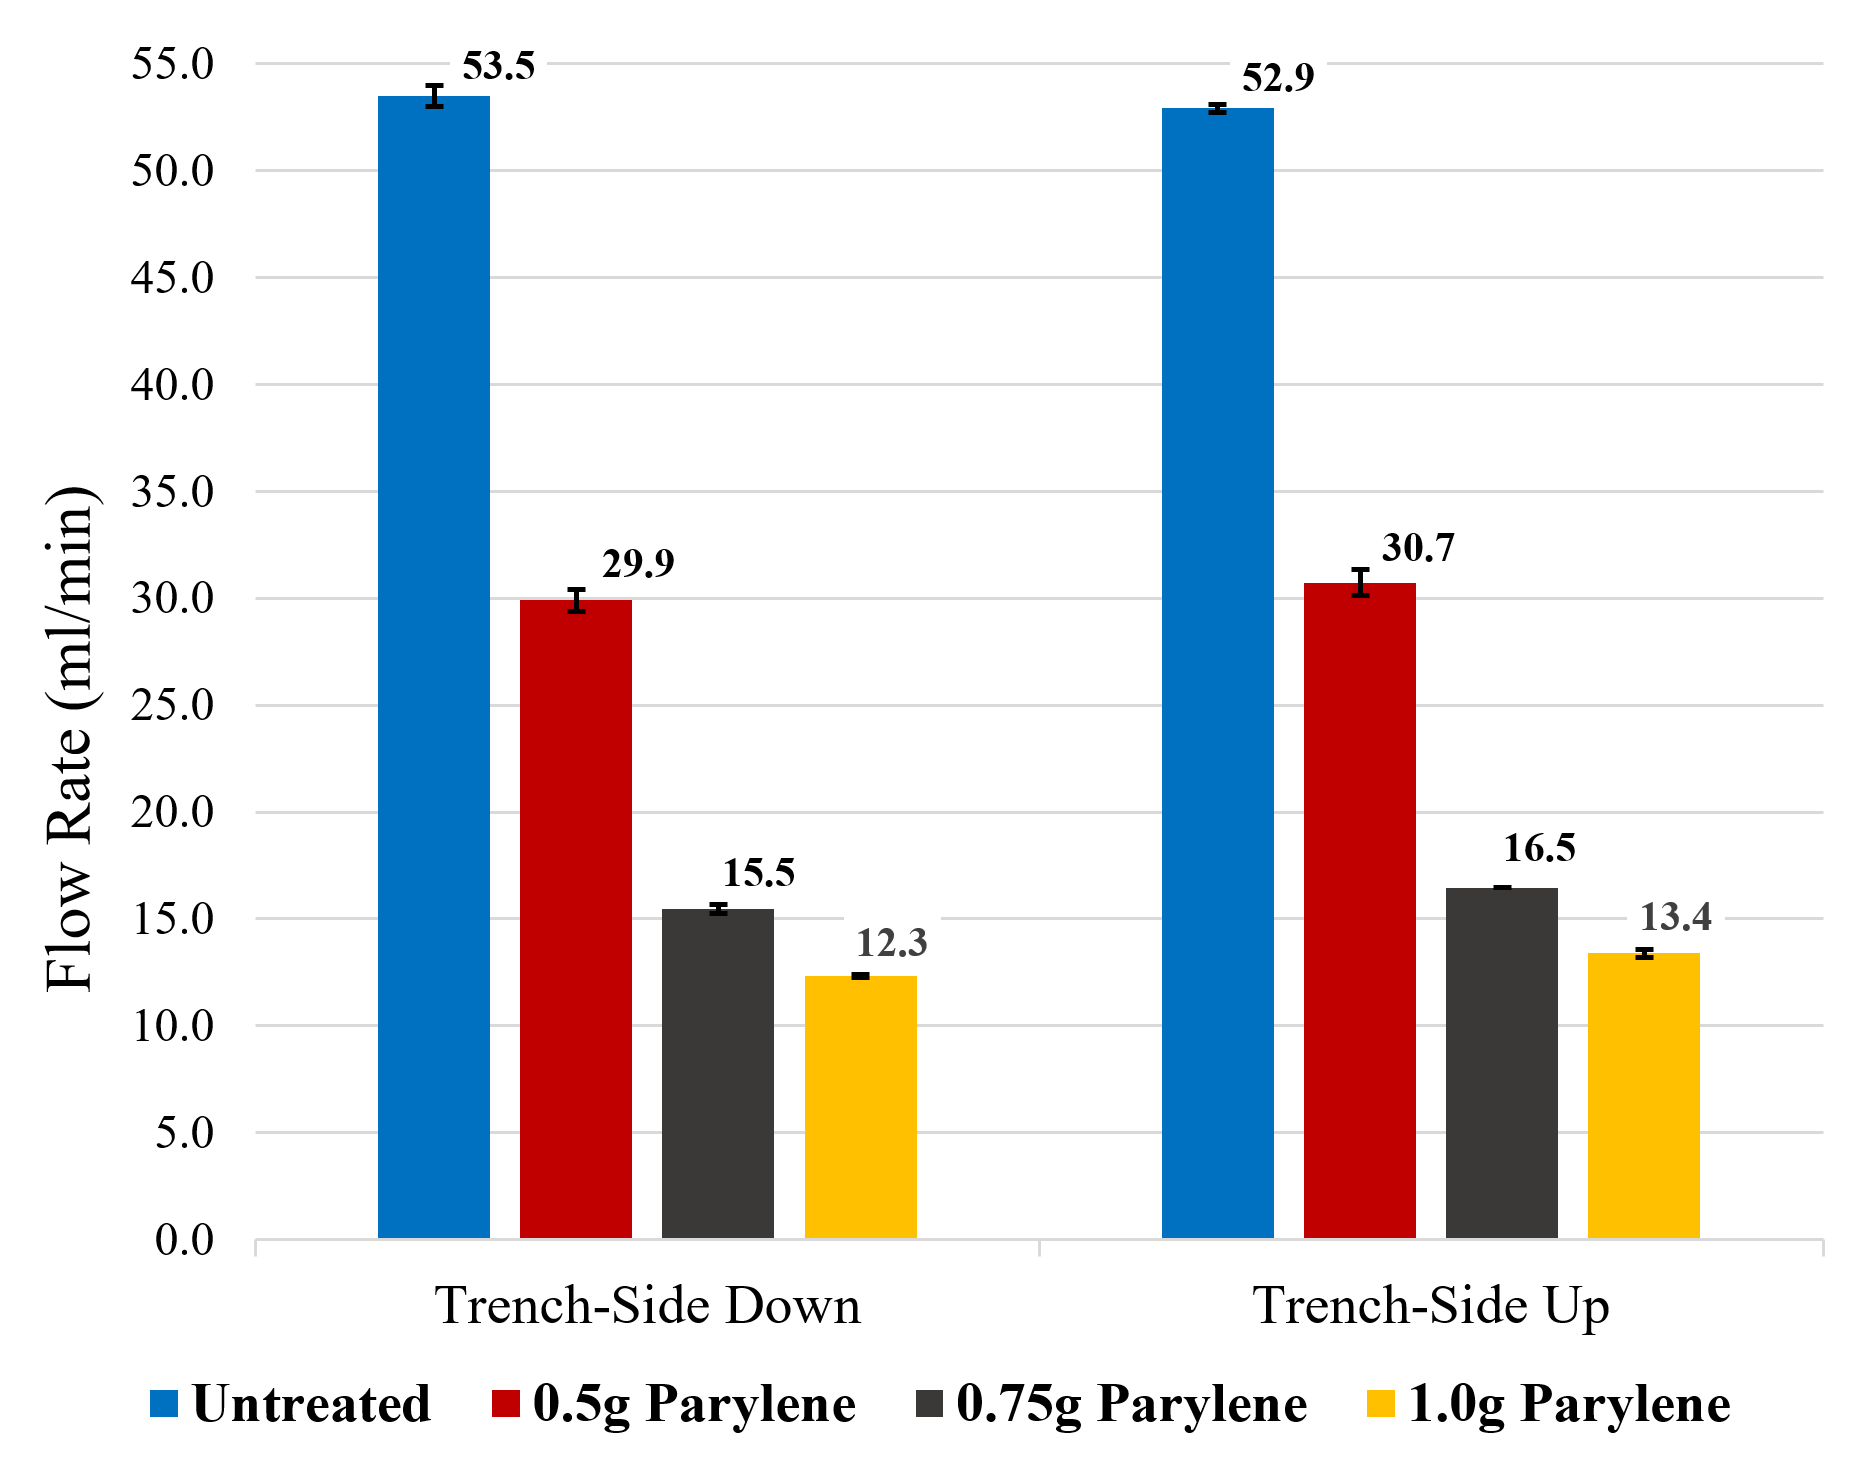
The results from permeance testing are presented in Figure 4.
Conclusion & Discussion
It cannot be definitively concluded that there is a direct correlation between parylene treatment amount and membrane burst pressure. There appears to be an increasing trend with larger amounts of parylene treatment, however, statistical analysis disproves this theory. For trench-side up tests, burst pressures presented a large degree of variability which led to insignificant differences among membrane burst pressure. For trench-side down tests, burst pressures samples were much more consistent yet significant differences between treatment groups does not exist.
Some of this variation can be attributed to the experimental process as burst pressure tests were not perfectly repeatable. Using an approximate rate to increase supply pressure introduces another variable of membrane exposure time at any given pressure. This begins to address the concept of membrane fatigue, or how long a membrane can withstand a certain pressure. Therefore, in the future, burst pressure testing should be automated with consistent rates of pressure increase. Perhaps a more prominent source of variability in testing may have been a non-conformal parylene deposition process, which can only be affirmed upon SEM inspection. Despite the fact that these were small sample sizes, it does not appear that we can expect to achieve any consistent increase in membrane reinforcement as a result of current parylene treatments.
As for permeance results, consistent data was achieved that showed exponential flow rate decreases upon incremental increases in parylene treatment amount. Results were fairly consistent between membrane orientation and only significantly differed when parylene treatment amounts reached 0.75g. These repeatable findings are promising and may indicate that parylene treatments yielded similar pore size reductions among multiple membranes. This assumption does need to be confirmed with SEM, and if true, parylene treatments could prove to be a valuable approach to control pore sizes and diffusion selectivity. With respect to future testing, an array of parylene amounts should be used to treat membranes, and permeance, as well as SEM, should be performed to establish reliable correlations.
The parylene-C was deposited at RIT with the Labcoater II with the help of Dr. Carter. The chips where placed flat-side up. Two other options exist, trench-side up, and held in a fixture with both sides exposed to the deposition. Perhaps the latter would provide more of an increase in strength. It’s still possible, if we can deposit the right amount, that parylene would benefit nanoporous membranes more than microporous membranes.
There are plans to peek at these with SEM, to verify thickness and see what we can tell about parylene pore penetration performance and properties by parameter… (pretty soon).