Flow Through Affinity Based Capture or a Lack Thereof, the Story of a Chemist’s Folly
Fluorescent Streptavidin Coated Bead Capture on Biotin KODE Coated Surfaces
After determining that KODE molecules can successfully coat our silicon pore membranes, we set out to determine if the coating could be functional and how stable it was. To test both factors concurrently we designed experiments in an attempt to capture 1.24 um diameter fluorescent streptavidin coated beads with KODE functionalized surfaces using a flow through setup. These experiments looked at many different aspects of coating and bead capture, and the following sections give a brief synopsis of each experiment as well as videos of the resulting capture when available. As these videos come off of the microscope in massive file sizes, the videos here have been scaled down for display purposes. Most of these experiments were done using a flow through setup. The last three are where my folly comes into play. For these experiments I hooked up the devices wrong and instead made a hybrid tangential flow/flow through device. This caused confusing and unexpected results which were baffling, until I realized my mistakes. As I believe all data has value, even data made in err, I will still present the incorrectly completed experiments and make appropriate conclusions off of them. I will however redo these experiments and present the correct data in the future.
Static Streptavidin Bead Capture on Uncoated vs Biotin KODE Coated Membranes
To determine if streptavidin beads would link to biotin KODE, I coated 1 um slit chips with biotin KODE and statically exposed them to beads. This involved piranha cleaning the chips, dip coating in a 50 uM biotin KODE DI solution, drying, and then cleaning the membranes with DI water. I then took 60 uL of stock bead solution and dispersed it in 0.5 mL of DI water. After sonication I submerged coated and uncoated chips in the solution overnight. After this time I took each chip out, imaged them, cleaned them with DI water, and then imaged them again. The resulting Figure 1 was made from these images.
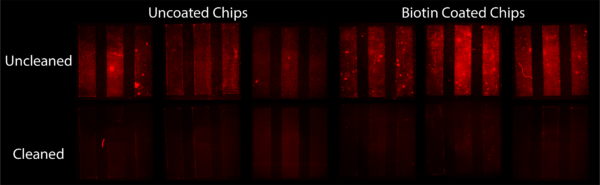
The results showed that regardless of coating, beads bound to the surface. This was our first indication that we had a nonspecific binding issues with these beads. The slightly greater intensity of fluorescence on the biotin KODE coated surfaces gave us hope that there was some specific binding of beads in addition to this nonspecific binding. These results were also skewed by a miscalculation of stock solution bead concentration. It was found we were off by an order of magnitude making the bead concentration used in this experiment extremely concentrated. We hypothesize this high concentration of beads would promote nonspecific binding, further hiding any specific binding occurring.
Flow Through Streptavidin Bead Capture
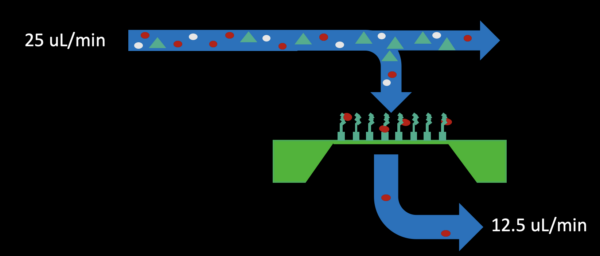
Moving forward we attempted to do the same experiment under flow with an adjusted bead concentration. Chips were prepared the same as before and bead solutions were made by putting 10 uL of stock solution into 1 mL of DI water. This solution was flown over chips using the following flow procedure:
– Initial fill using flow with 50% pull through the bottom for 5 minutes (25 uL/min infusion in the top inlet channel, 12.5 uL/min withdraw from the bottom outlet shown below)
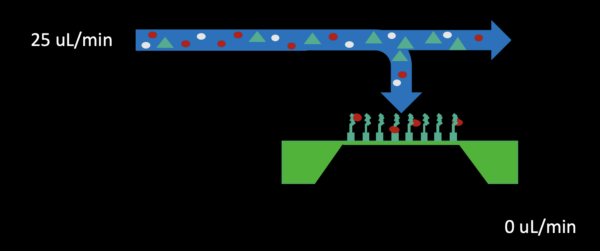
– Bottom channel pressure release by stopping pull from the bottom outlet for 2-3 minutes (shown below)
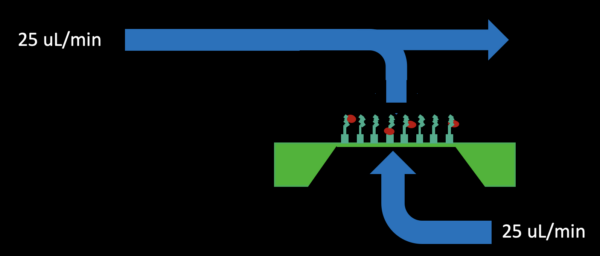
– Reverse flow through the bottom channel outlet at 100% (25 uL/min) for 2-3 minutes (shown below)
Results with biotin KODE coated chips and uncoated chips are shown in Figure 2.

Confocal videos of each step of the flow procedure are as follows:
Biotin KODE Coated 1 um Chip
Initial Fill 1080 – Shows the initial bead capture
Reverse 2 1080 – Shows physically bound beads getting knocked off a second time due to reversing flow from the bottom channel
Saturation 1080 – Shows what we believe to be the result of complete membrane saturation with beads
Uncoated 1 um chip
Initial Fill 1080 – Shows the initial bead capture
Release Bottom Channel Pressure 1080 – Shows the result of turning the pump withdrawing from the bottom channel off
Reverse Flow 1080 – Shows physically bound beads getting knocked off due to reversing flow from the bottom channel
This same experiment was also done with 8 micron slit chips and the results are shown in Figure 3.

Confocal videos of each step of the flow procedure are as follows:
Biotin KODE Coated 8 um Chip
Bottom Channel Pressure Release 1080
Uncoated 8 um chip
Bottom Channel Pressure Release 1080
Both experiments clearly showed that beads were captured more readily with biotin KODE coated chips. 1 um slit chips demonstrated that beads could be captured physically and forced to bind with the biotin KODE on the surface of our chip. 8 um chips showed that even without physical capture, beads could be captured using our affinity based biotin-streptavidin linker. Affinity linked beads were determined after reversing flow. Reverse flow effectively knocks off all physically captured beads, leaving only affinity bound beads behind.
Nonporous Membrane Streptavidin Bead Capture
To check to see if our flow through setup enhanced particle capture compared to a flow over setup, we tested a flow over setup using a biotin KODE coated nonporous chip. The result can be seen in the confocal video below which shows very little to no particle capture. This supports our hypothesis that our flow through setup focuses particles on the surface of our membrane enhancing capture of targets, in this case streptavidin coated beads.
PEG KODE Blocking of Nonspecific Binding
In an attempt to decrease nonspecific binding that we see in our uncoated chips, we tried to block the surface of our chips using PEG KODE. The procedure to coat this chips was the same as before, the only difference is our uncoated chipset was dipped in a 50 uM solution of PEG KODE, dried, and cleaned with DI water. Instead of blocking nonspecific binding of beads, this seemed to enhance binding of streptavidin beads compared to the bare chip. Confocal videos of the flow procedure steps are shown below.
Bottom Channel Pressure Release 1080
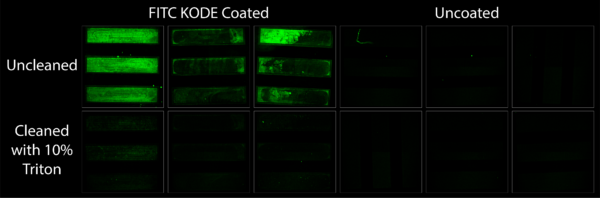
Re-use of KODE Coated Membranes
Amidst these capture experiment a question came up with regard to the reusability of chemically coated membranes. If after capture membranes were still intact, could the KODE coating be washed off and the chips re-used? This experiment set out to answer this question via the use of FITC KODE and 10% Triton. Being amphiphilic molecules themselves, it was thought that KODE molecules could be washed off of a surface with a detergent having greater than a 3% concentration. Figure 4 shows this is true, at least for 10% Triton. FITC KODE coated membranes before cleaning fluoresced nicely. After cleaning they showed no fluorescence at all. This leaves the door open for future re-use applications when using affinity based capture methods.
*The Beginning of my folly
As mentioned above all of the experiments below this point were not done with a flow through setup like I had originally thought, instead they were done using a hybrid tangential flow/flow through setup. This setup was made after I incorrectly hooked the outlet pump to the top channel outlet instead of the bottom channel outlet. This meant that all pumped flow was through the top channel, therefore the only flow that went through the membrane was flow that saw less resistance there. This setup allowed for bead capture, but did not allow me to dislodge physically bound beads. As a result all of the data gathered below could have been produced from physically bound beads or chemically bound beads. Answers to which beads are responsible for what will be coming in the near future when I redo these experiments.
BSA Blocking of Nonspecific Binding
Similar to the experiment done above using PEG KODE, we again attempted to block nonspecific binding of beads using a 10% BSA solution. An uncoated 1 um slit chip was submerged in 10% BSA for 30 minutes, cleaned and exposed to streptavidin beads via my hybrid tangential flow/flow through setup. The confocal videos below show what happened at each step of my flow procedure. Now knowing this setup was incorrect these experimental results leave a lot to be desired as potentially this coating worked correctly, I just was unable to blow off physically bound beads. This experiment will certainly be repeated in the future with the correct setup in order to properly evaluate its nonspecific binding blocking abilities.
Bottom Channel Pressure Release 1080
Binding Fluorescent Antibody via a Molecular Stack
Building off of our success capturing streptavidin beads with biotin KODE coated surfaces, our next step was to try to coat our membranes with antibody in order to set ourselves up for application based experiments. I did this by following the same procedures as before, the only difference is after capturing beads on the surface of our membranes I took the chips out of the my flow device and exposed them to a 1% biotinylated protein G solution for 30 minutes, cleaned them with DI water, and exposed them to a 1% fluorescent human IgG solution for 30 minutes. Hypothetically this would create molecular stacks on the membrane with biotin KODE anchored to the membrane surface, streptavidin beads attached to the biotin side of the KODE, biotinylated protein G attached to the other side of the streptavidin beads, and human IgG attached to the protein G. Afterwards I cleaned each chip with DI water and then imaged the chips under a far red beam and filter (637 nm/700 nm) and a FITC beam and filter (484 nm/525 nm). The streptavidin beads fluoresce under the far red filter and the human IgG fluoresces under the FITC filter. The resulting images are compiled in Figure 5.
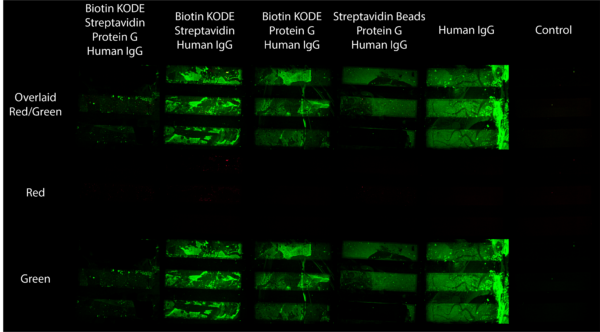
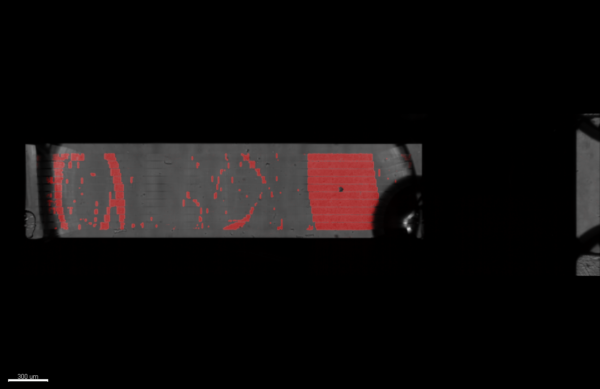
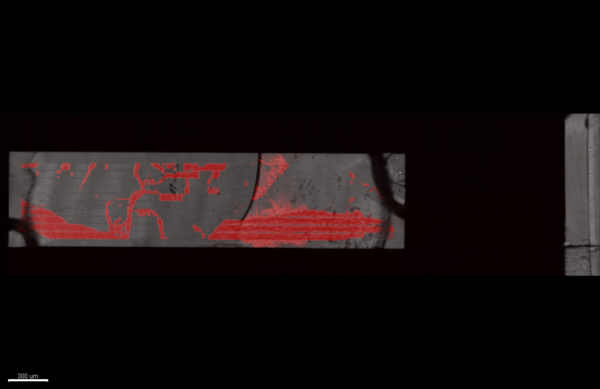
As the Figure shows, this experiment did not go according to plan instead giving us antibody fluorescence just about everywhere except for where we wanted it (the fully functional stack in column 1). We attributed the overwhelming green glow to nonspecific binding after soaking each membrane in fluorescent human IgG, therefore making accurate comparison between the chips difficult. With regard to the bead component of this Figure, it is worth noting two things: the first is that as previously mentioned this flow setup was not correct, the second is that it was found the first 2 chips in this Figure were not completely porous. This became apparent after watching bead capture happen in real time with beads capturing in odd patterns instead of membrane wide as is usually seen. These results are shown in Figures 6 and 7 below.
While these results leave a lot to be desired, the next experiment answered some questions and redoing these experiments will answer some more.
Capturing Pre-Mixed Streptavidin Bead/Biotinylated Protein G/Fluorescent Human IgG
To cut down on the amount of nonspecific binding we saw from our antibody, we decided to try to pre-mix our components to make our molecular stacks which we would then flow over biotin KODE coated membranes. This involved calculating the total number of beads in 10 uL of stock solution, using the diameter of biotinylated protein G to determine the amount of 1 mg/mL solution I would need to coat 10% of each streptavidin bead, and determining the amount of antibody I needed to have a reasonable excess of antibody to protein G. Altogether this resulted in 10 uL of beads getting dispersed in 1 mL of DI water, 1 uL of a 1 mg/mL protein solution being diluted in 100 mL of DI water and 1.4 uL of this diluted solution getting added to the bead solution, and 1 uL of a 1 mg/mL solution of antibody being added to 10 mL of water with 1 uL of this solution getting added to the bead mixture. With all three components added, this mixture was allowed to interact on a rotating mixer for 30 minutes. The chip which was coated with biotin KODE was loaded into my hybrid tangential flow/flow through setup and the mixture was flown over following the same flow procedure as before. The resulting antibody coating is shown in Figure 8.
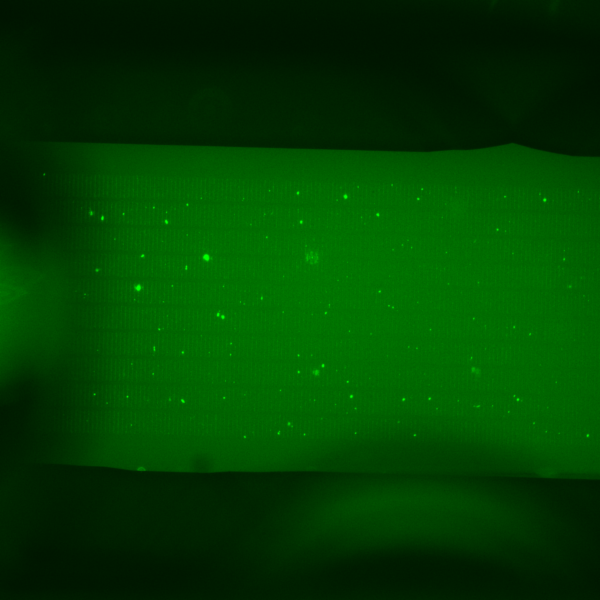
The result seemed to show our mixture may have worked properly, but it was hard to tell because of the large aggregates of antibody dispersed across the membrane. Our imaging quality was also slightly diminished after using the epifluorescent scope to image this chip instead of the confocal. Looking closely it looks like you can see beads glowing green captured in the slits of the chip. Because it was so hard to accurately determine if we had successfully captured bead stack in our membranes, we decided to set up the next experiment in an attempt to get rid of antibody aggregates and to get better quality images on the confocal.
Capturing Pre-Mixed Streptavidin Bead/Biotinylated Protein G/Fluorescent Human IgG After Antibody Centrifugation
To complete this experiment I followed the same procedure as the previous experiment. The only difference is for this experiment after diluting 1 uL of antibody into 10 mL of DI water, I spun 1 mL of the mixture in a centrifuge at 2500 G for 30 minutes to try to get rid of the aggregates we saw in the previous experiment. From this spun down mixture I took 1 uL and added it to the bead mixture to interact while rotating for 30 minutes. This mixture was flown over biotin KODE coated membranes, as well as another mixture which had no antibody in the mixture. The results are shown below in Figures 9 and 10.

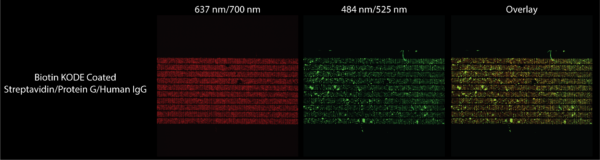
Figure 9 shows that any green fluorescence that we are seeing under the FITC filter is certainly from fluorescent human IgG. Figure 10 shows that there is a great positive correlation between where beads are and where fluorescent antibody is, suggesting low nonspecific binding of the antibody and binding of antibody to the beads. While the images are of higher quality because of the confocal, the presence of antibody aggregates was not diminished leaving clearer results to be desired. The presence of a bubble in the images of the chip not exposed to antibody also diminishes the quality of those results. Therefore while these results give us some hope that capturing molecular stacks may be the way forward when functionalizing our membranes, future experiments must be done to get rid of antibody aggregates through more aggressive filtering methods. I must also hook up the flow device correctly which would ascertain that the beads we see here are chemically bound as opposed to just physically bound.
Conclusions
From all of this we learned the following:
- The biotin-avidin linkage has certainly lived up to its name, providing us a strong and easy way to link components to the surface of our membranes using biotin KODE
- Beads can be captured out of solutions statically and under flow by either forcing them to interact with our surface coating by using slits smaller than the beads or just by picking them out of solution taking advantage of flow concentrating beads on slits larger than the beads
- Reverse flow in a flow through setup knocks off physically bound beads and leaves behind chemically bound beads, that is if you set the system up correctly
- Nonspecific binding is and still remains a problem for us, we will continue to work on ways to prevent it or just learn to live with a somewhat undesirable baseline
- Re-use of KODE coated membranes is possible as long as the membrane remains physically intact after experimentation
- Membranes may be able to be coated with antibody most effectively by coating with biotin KODE and capturing molecular stacks of streptavidin/biotinylated protein/antibody