Plasma Problems
Introduction
This post will detail the work completed in the last chapter of my Thesis. The overarching goal of this chapter was to perform dialysis on whole blood utilizing a serial-separation system. This system would first: generate plasma from whole blood and second: remove uremic toxins from plasma employing microporous and nanoporous membranes, respectively. Conducting dialysis on solely the plasma component of whole blood offers a safer alternative compared to traditional hemodialysis (HD) systems.
During HD treatments whole blood is subject to extracorporeal circulation in which blood damage is unavoidable [1]. Additionally, anemia is well documented among those afflicted with chronic kidney disease (CKD) and is caused by various factors including reduced red blood cell (RBC) lifespan [2]. It has been posited that extracorporeal circulation contributes to reduced RBC lifespan via mechanical stress [1], immune cell activation [3], and RBC membrane protein and lipid compositional alterations [4,5]. A serial-separation HD process would first shunt cellular populations thus, avoiding extracorporeal circulation altogether and its associated adverse interactions with blood cells. Furthermore, a process such as this would model physiological renal filtration as the fenestrae within glomerular endothelial cells retain RBCs to produce a primary urinary filtrate.
Methods
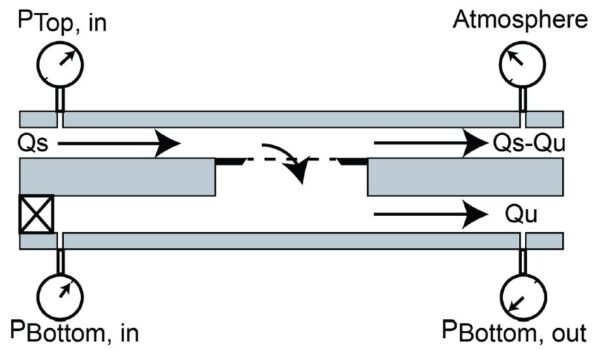
Since a vastly complex biofluid such as whole blood has not been processed in this format with ultrathin membranes, an intermediary complex solution was sought out. Plasma was chosen as it offers a largely heterogeneous protein population while omitting cells. Tangential flow filtration (TFF) experiments were carried out to assess the performance of 0.5 µm slit pore membranes. The TFF flow regime (Figure 1) splits flow at the membrane as a fraction passes tangentially over while the other fraction is pulled through the membrane. Transmembrane pressure (TMP) was continuously monitored as increases in TMP are indicative of fouling.
Results & Discussion
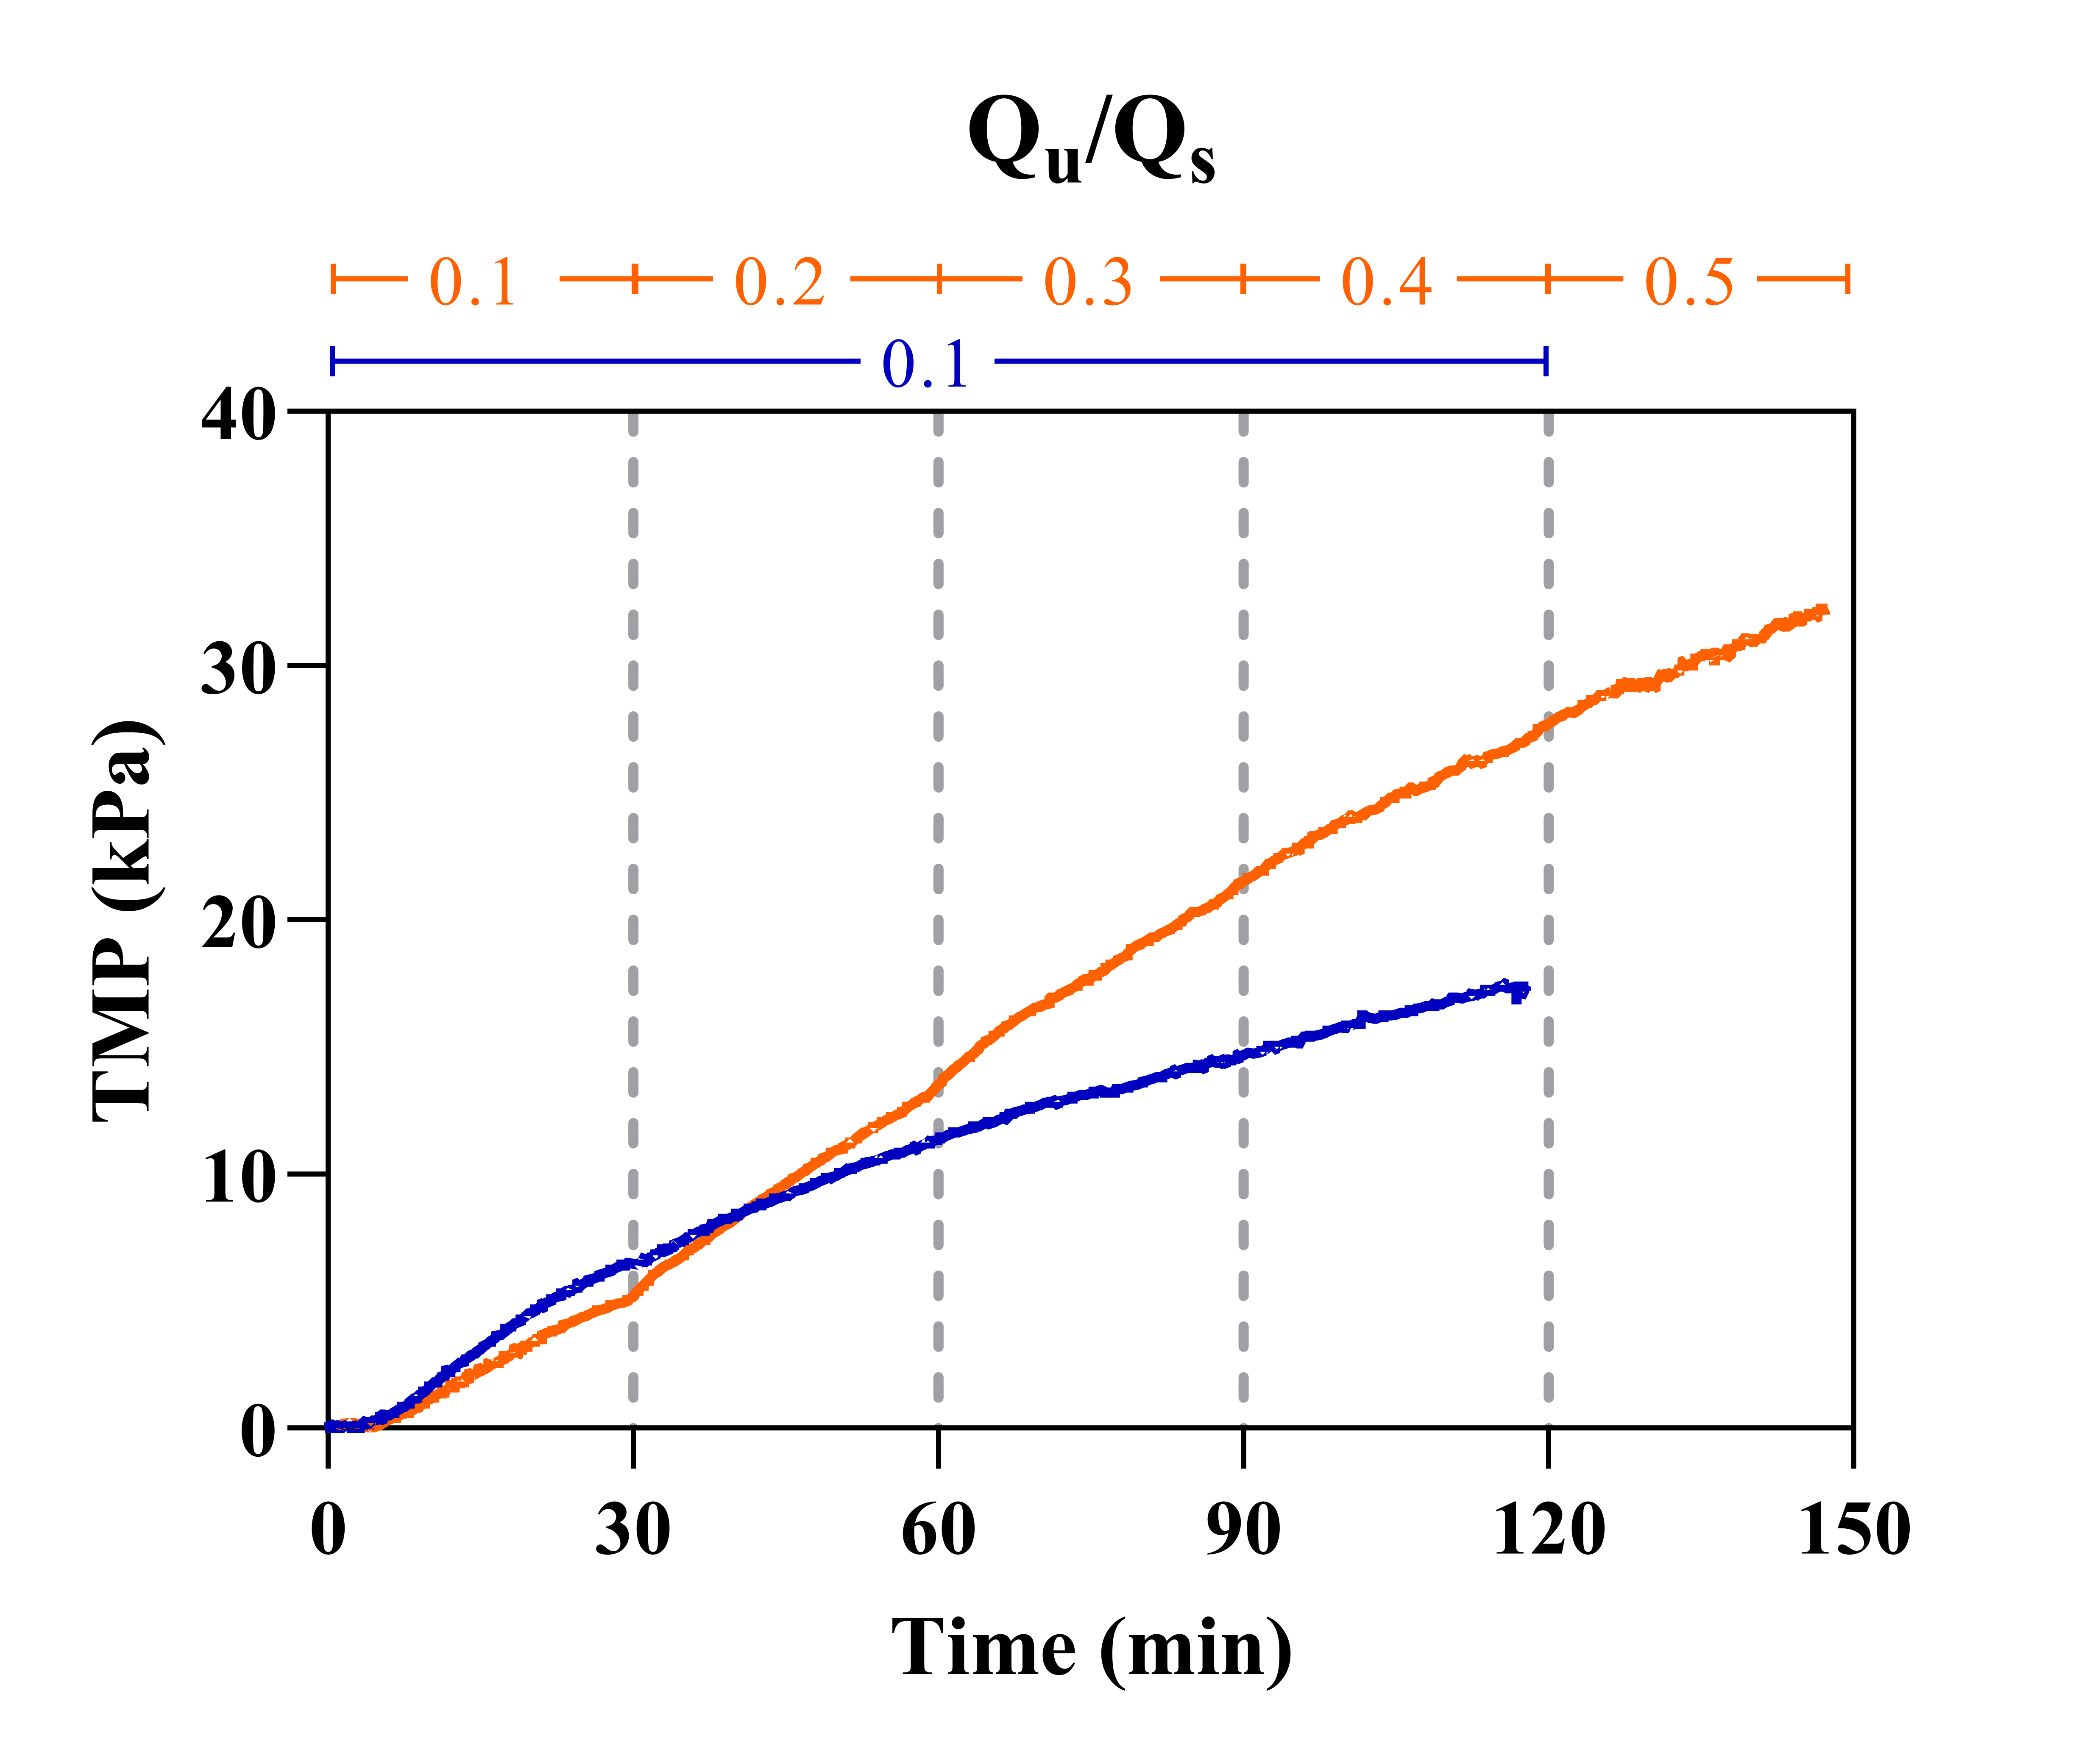
Figure 2 shows the results of flux-stepping experiments in which the ultrafiltration rate (Qu) was incrementally increased from 10-50% relative to the supply rate (Qs), which was maintained at 30 µL/min.

It appears that TMP never stabilizes but rather linearly rises under each Qu condition eventually reaching pressures of 32 kPa (4.6 PSI). This means that the critical flux exists well below any of the observed Qu conditions. Additionally, cake layer formation can be visualized between 60-90 minutes of operation; a white plaque is clearly deposited on top of the membrane surface changing its appearance. Cake layer formation is also accompanied by air entering the system which is due to an increase in membrane resistance and thus a decrease in the relative resistance of pulling air through pressure sensor junctions, syringe tip connections, and/or the PDMS layer. Throughout the course of the experiment, that is before and after cake layer formation, filtrate is generated on the order of hundreds of microliters. This is not optimal for sustained operation, however, from a point-of-care standpoint filtrates are substantial and could be used for further analyses.
The argument could be made that if the lowest Qu condition was extended, a stable TMP could be reached as the profile was beginning to flatten after 30 minutes. To address this, the duration of the lowest Qu condition was extended to 2 hours (Figure 3).
The TMP profile of the constant-flux condition does continue to flatten over time, however, it never truly stabilizes. Furthermore, cake layer formation visualized in flux-stepping experiments was again apparent within the same period (60-90 minutes). Lowering Qu even further (Qu/Qs = 0.01) resulted in lower TMPs, although continuous fouling was still evident. Cake layer formation was not visible following 2 hours of operation, however, 1% ultrafiltration was considered unacceptable due to low volumes of filtrate generated (36 µL).
The next operating condition altered was Qs. The benefit of TFF is that the tangential flow component provides a shear force that acts to clear solutes away from the membrane surface, so increasing the supply rate should reduce fouling potential. Qs = 30, 60, 90, and 120 µL/min conditions were employed (Figure 4).
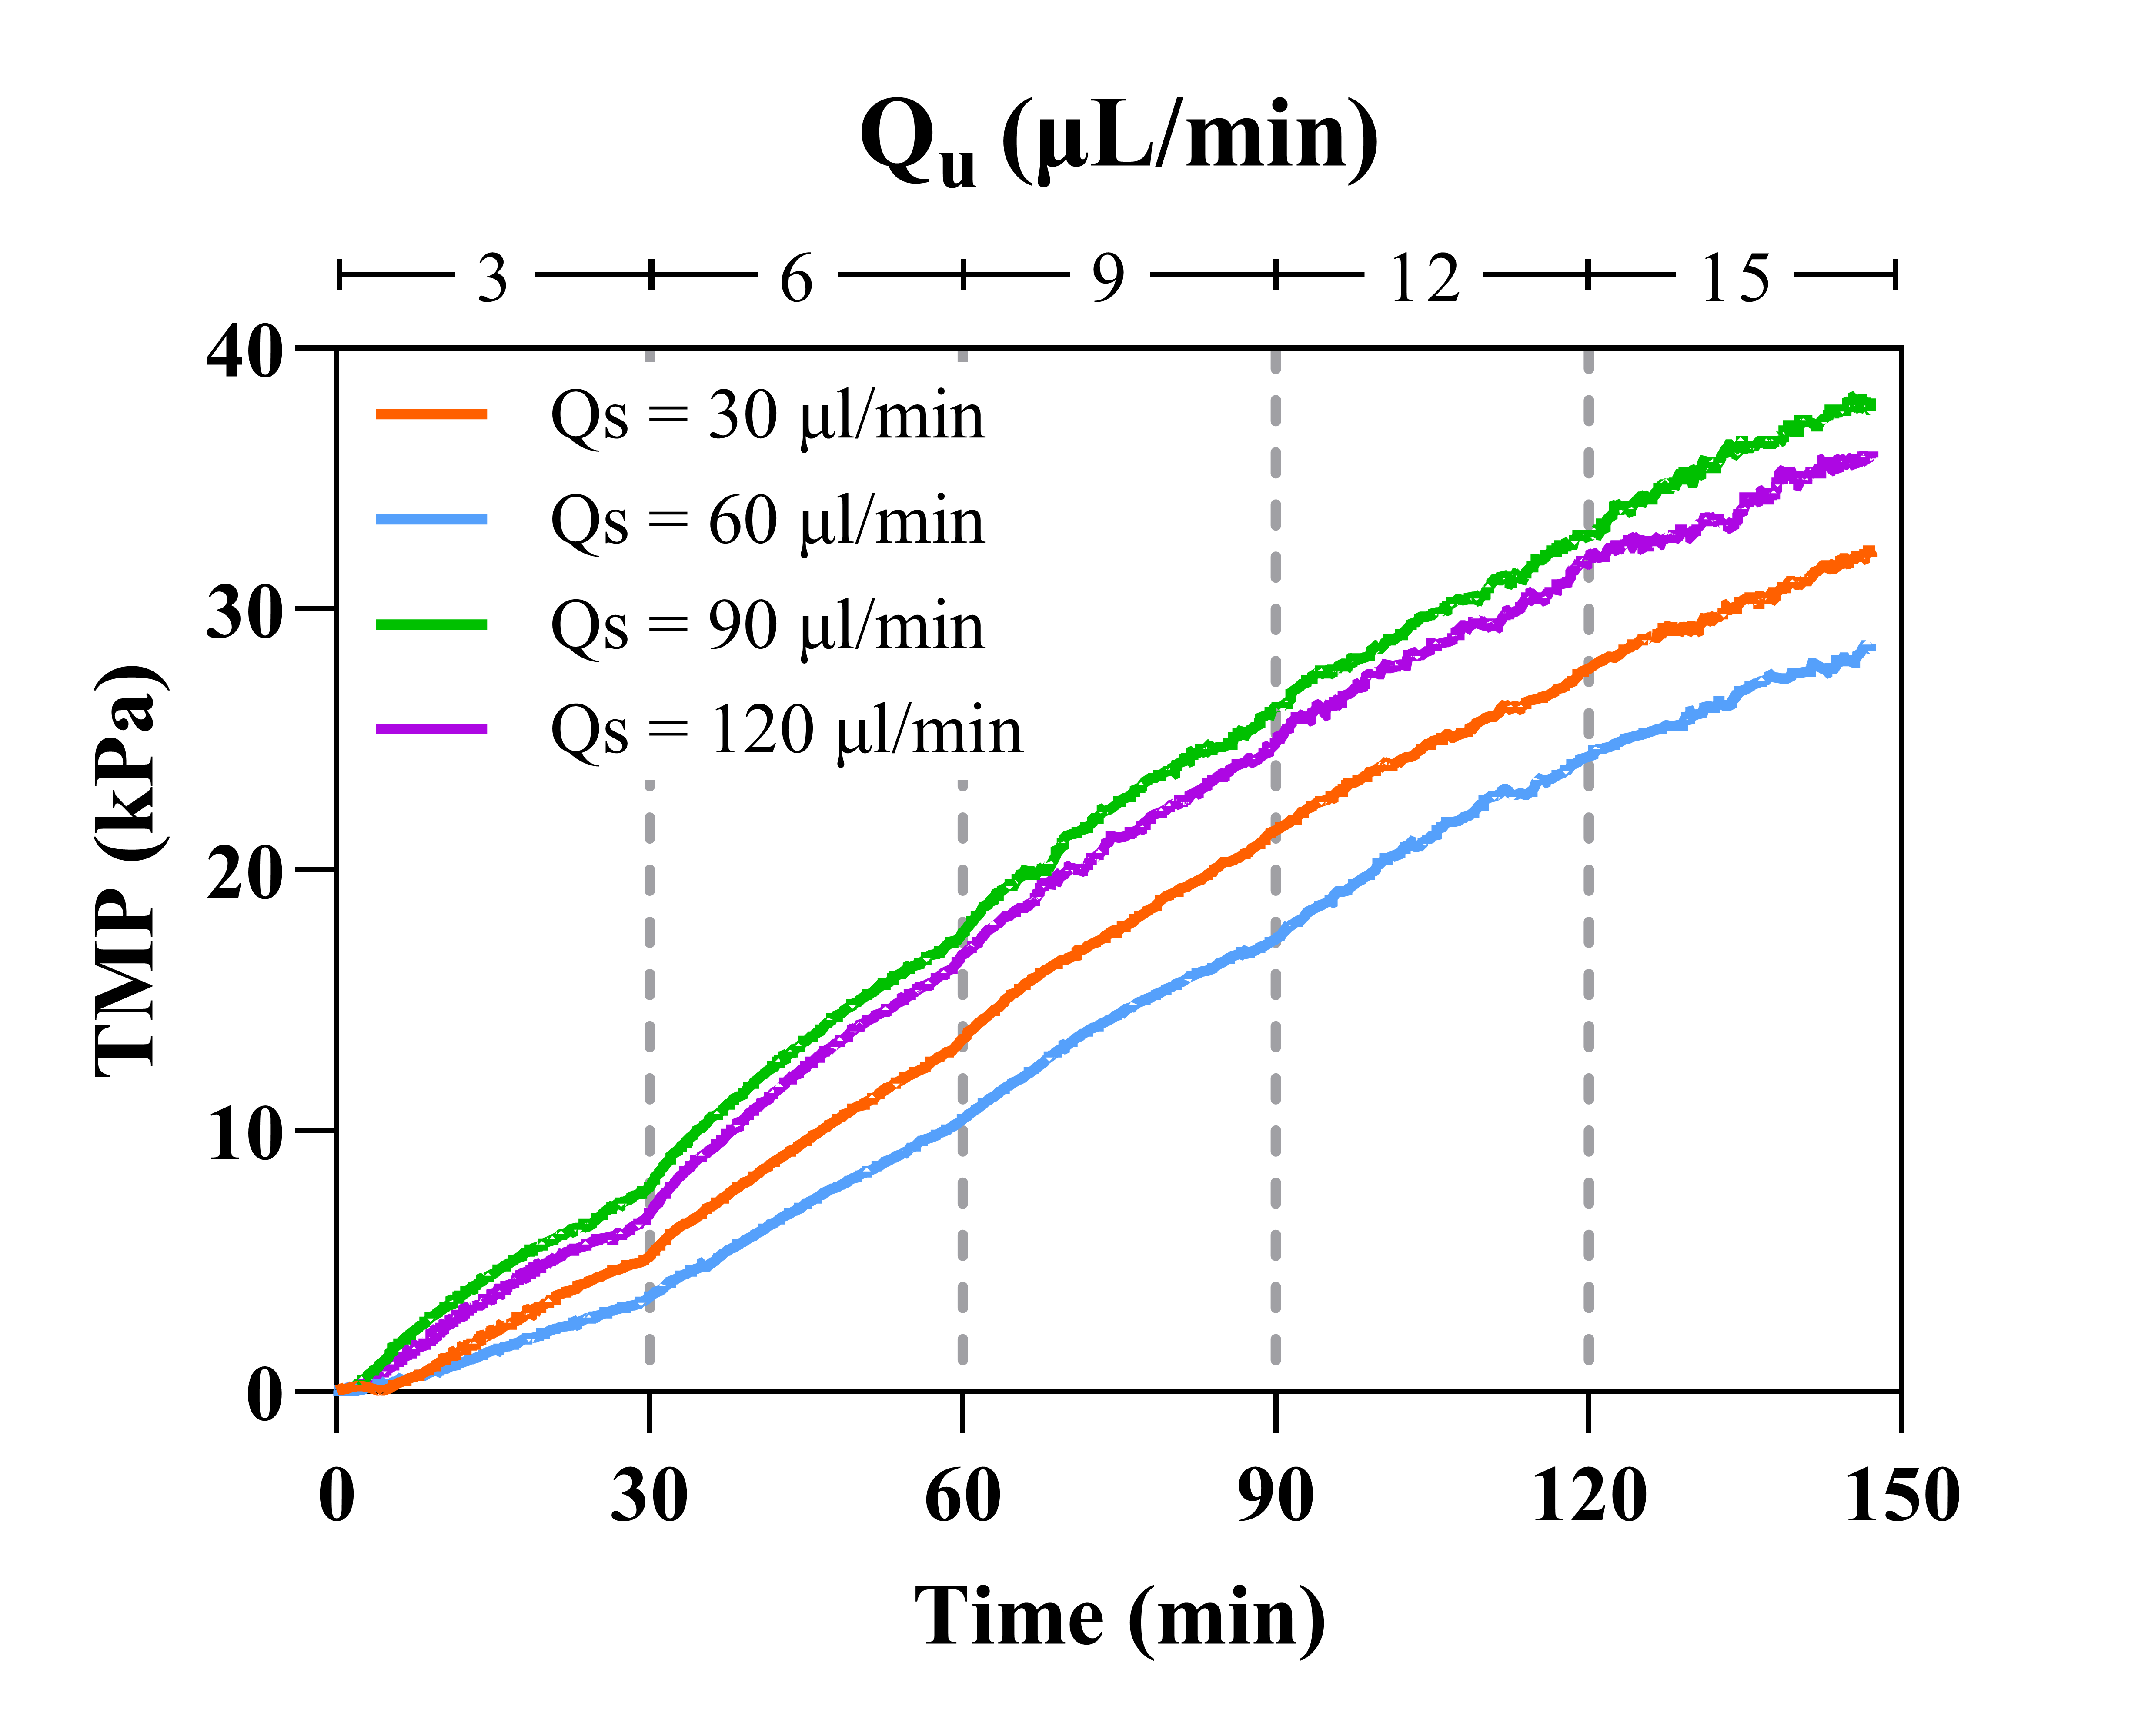
All TMP profiles look rather similar across all Qu conditions. Despite the subtle differences, system behavior was unchanged across all Qs observed as cake layer formation and air contamination was visible within the same time period (60-90 minutes). It is clear that increasing Qs is an insufficient clearing mechanism that is incapable of preventing extensive and rapid fouling. It has now been shown this fouling phenomenon occurs at virtually the same time in each experiment despite the Qs or Qu utilized.
Since cake layer formation seems to be time-dependent, this motivated an approach that considers changes in plasma composition over time. An obvious candidate is coagulation as clotting could yield large fibrin structures capable of occluding membrane pores. This was first investigated using FBS, a blood constituent deprived of coagulation function (Figure 5).
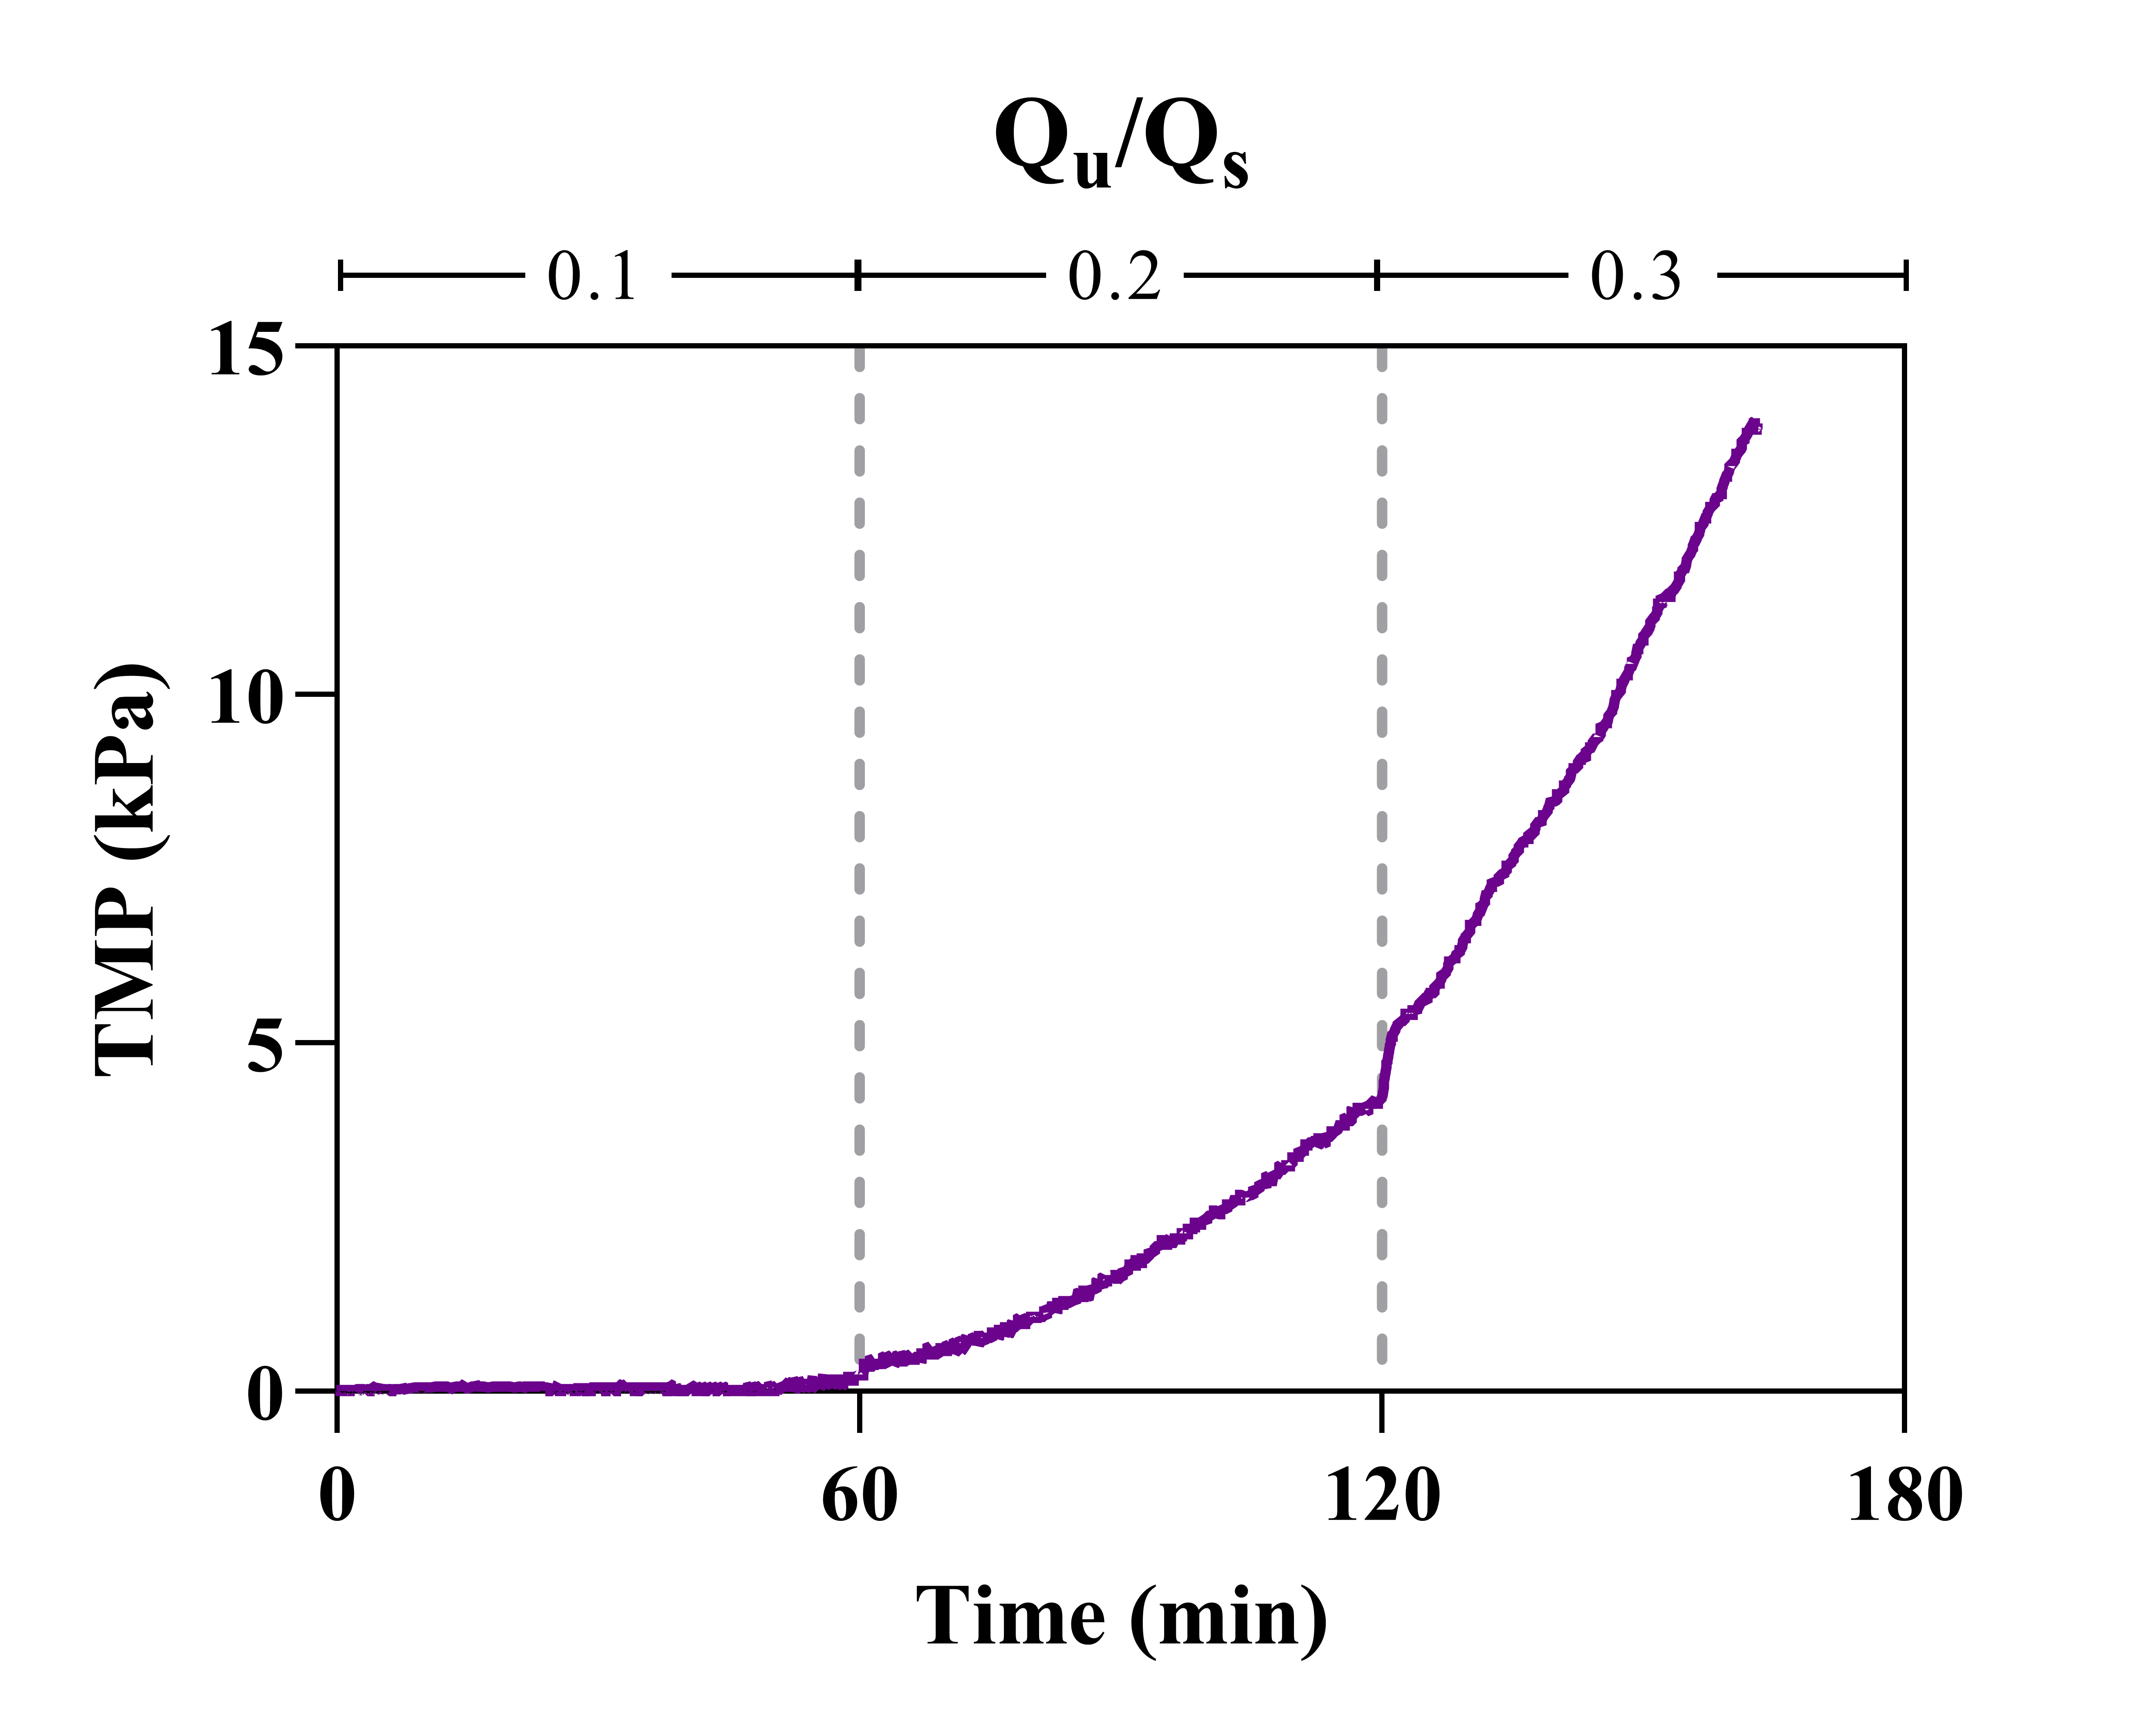
The TMP profile obtained from FBS does not resemble that of plasma. The lowest Qu condition was free from any appreciable pressure rise over an hour of operation and it is likely that a critical flux of Qu/Qs = 0.2 is achieved. Also, the cake layer challenging plasma experiments was not present. To further the hypothesis that coagulation could be responsible for plasma behavior, an additional anticoagulant (heparin – 30 IU/mL) was spiked into plasma (Figure 6). The vendor included EDTA during sample preparation, however, these anticoagulants have different mechanisms of action and this ensures that an appropriate concentration of anticoagulant was added immediately before experiments were carried out.

In constant-flux experiments employing the lowest Qu condition, TMP profiles of untreated and heparin-spiked plasma are rather comparable and system behavior was nearly identical: cake layer formation and air breaching. This finding detracts from the explanation that coagulation is the driving force between different behaviors observed for plasma and serum.
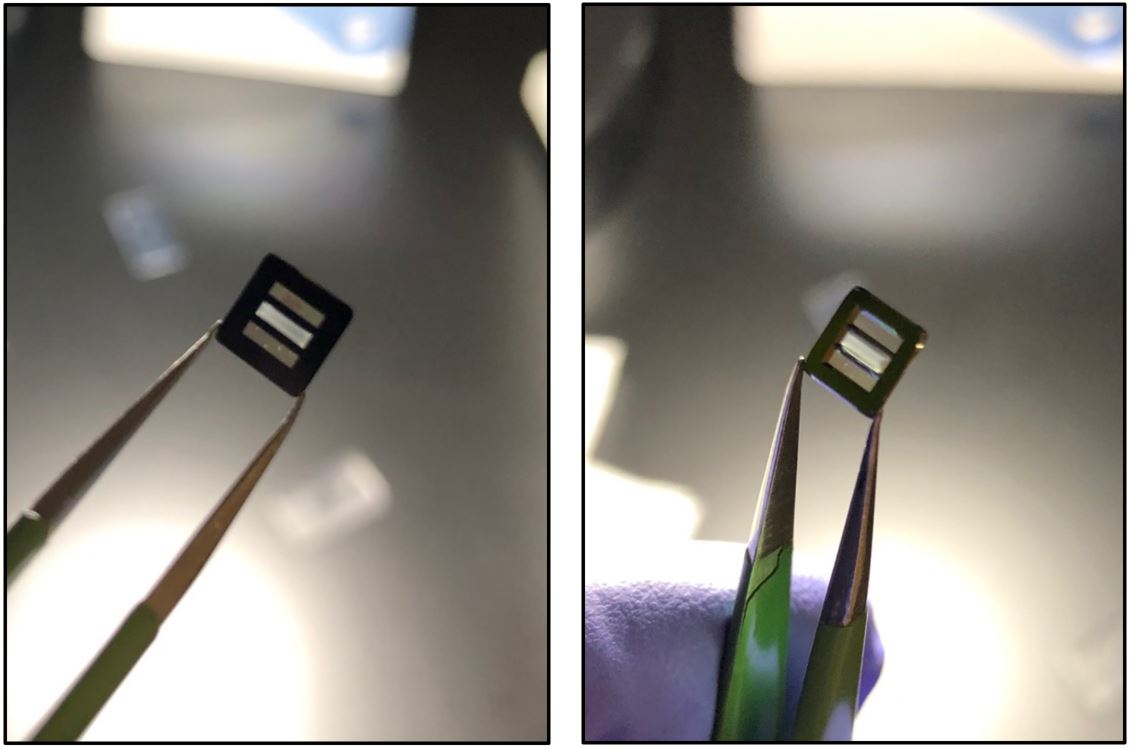
The next efforts in this work focused on identifying the composition of the cake layer captured on the membrane surface. This was done using clamped systems in which membranes can be retrieved following experimentation for further analyses (Figure 7).
The first analysis completed was SDS-PAGE to elucidate the protein population present in the cake layer (Figure 8).
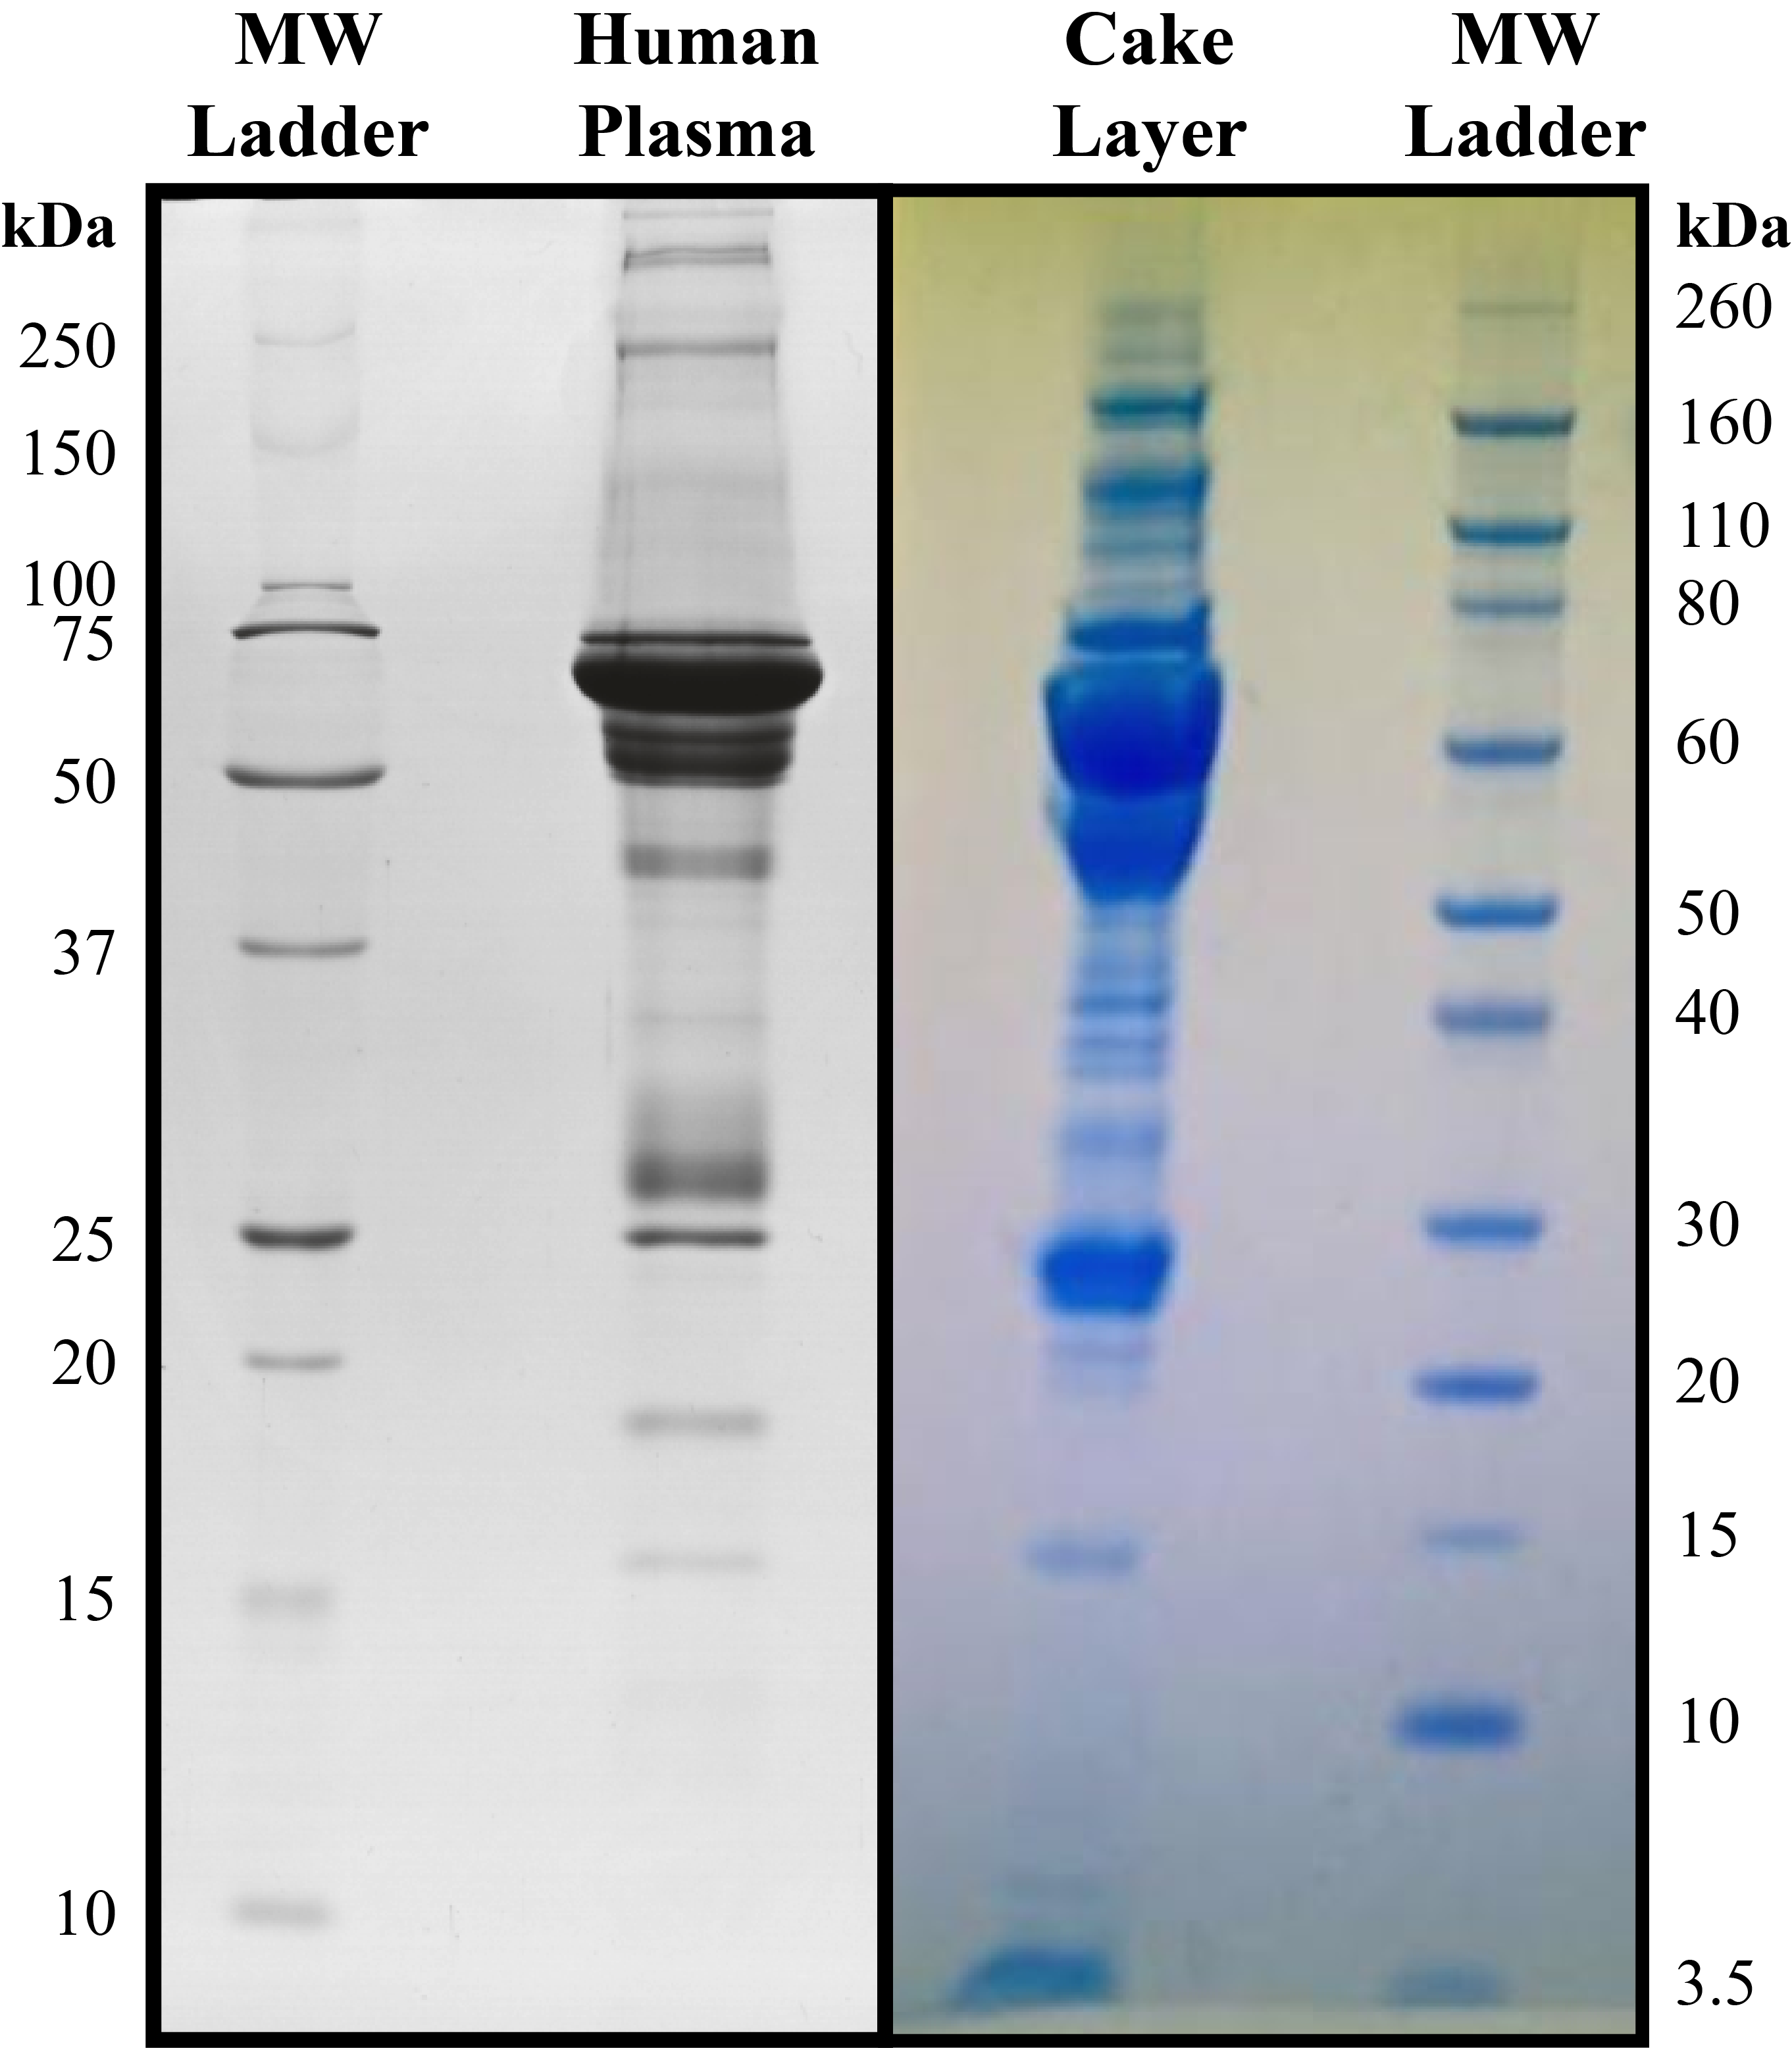
It appears that the cake layer is composed of the most abundant plasma proteins: albumin (66 kDa) and light (20-30 kDa) / heavy (50-60 kDa) chains of immunoglobulin molecules. These proteins have an overwhelming presence in plasma comprising more than 60-70% of its proteome [6]. This finding further contradicts the coagulation hypothesis as a clot should present strong signals corresponding to the three distinct polypeptide chains that constitute fibrinogen; α (66 kDa), β (52 kDa), and γ (47 kDa).
The milky-white appearance of the cake layer also motivated investigating lipid content; this was done by spiking feed solutions with the lipophilic dye Nile red (5 µg/mL). Membranes were recovered and immediately imaged on the fluorescence microscope (Figure 9).
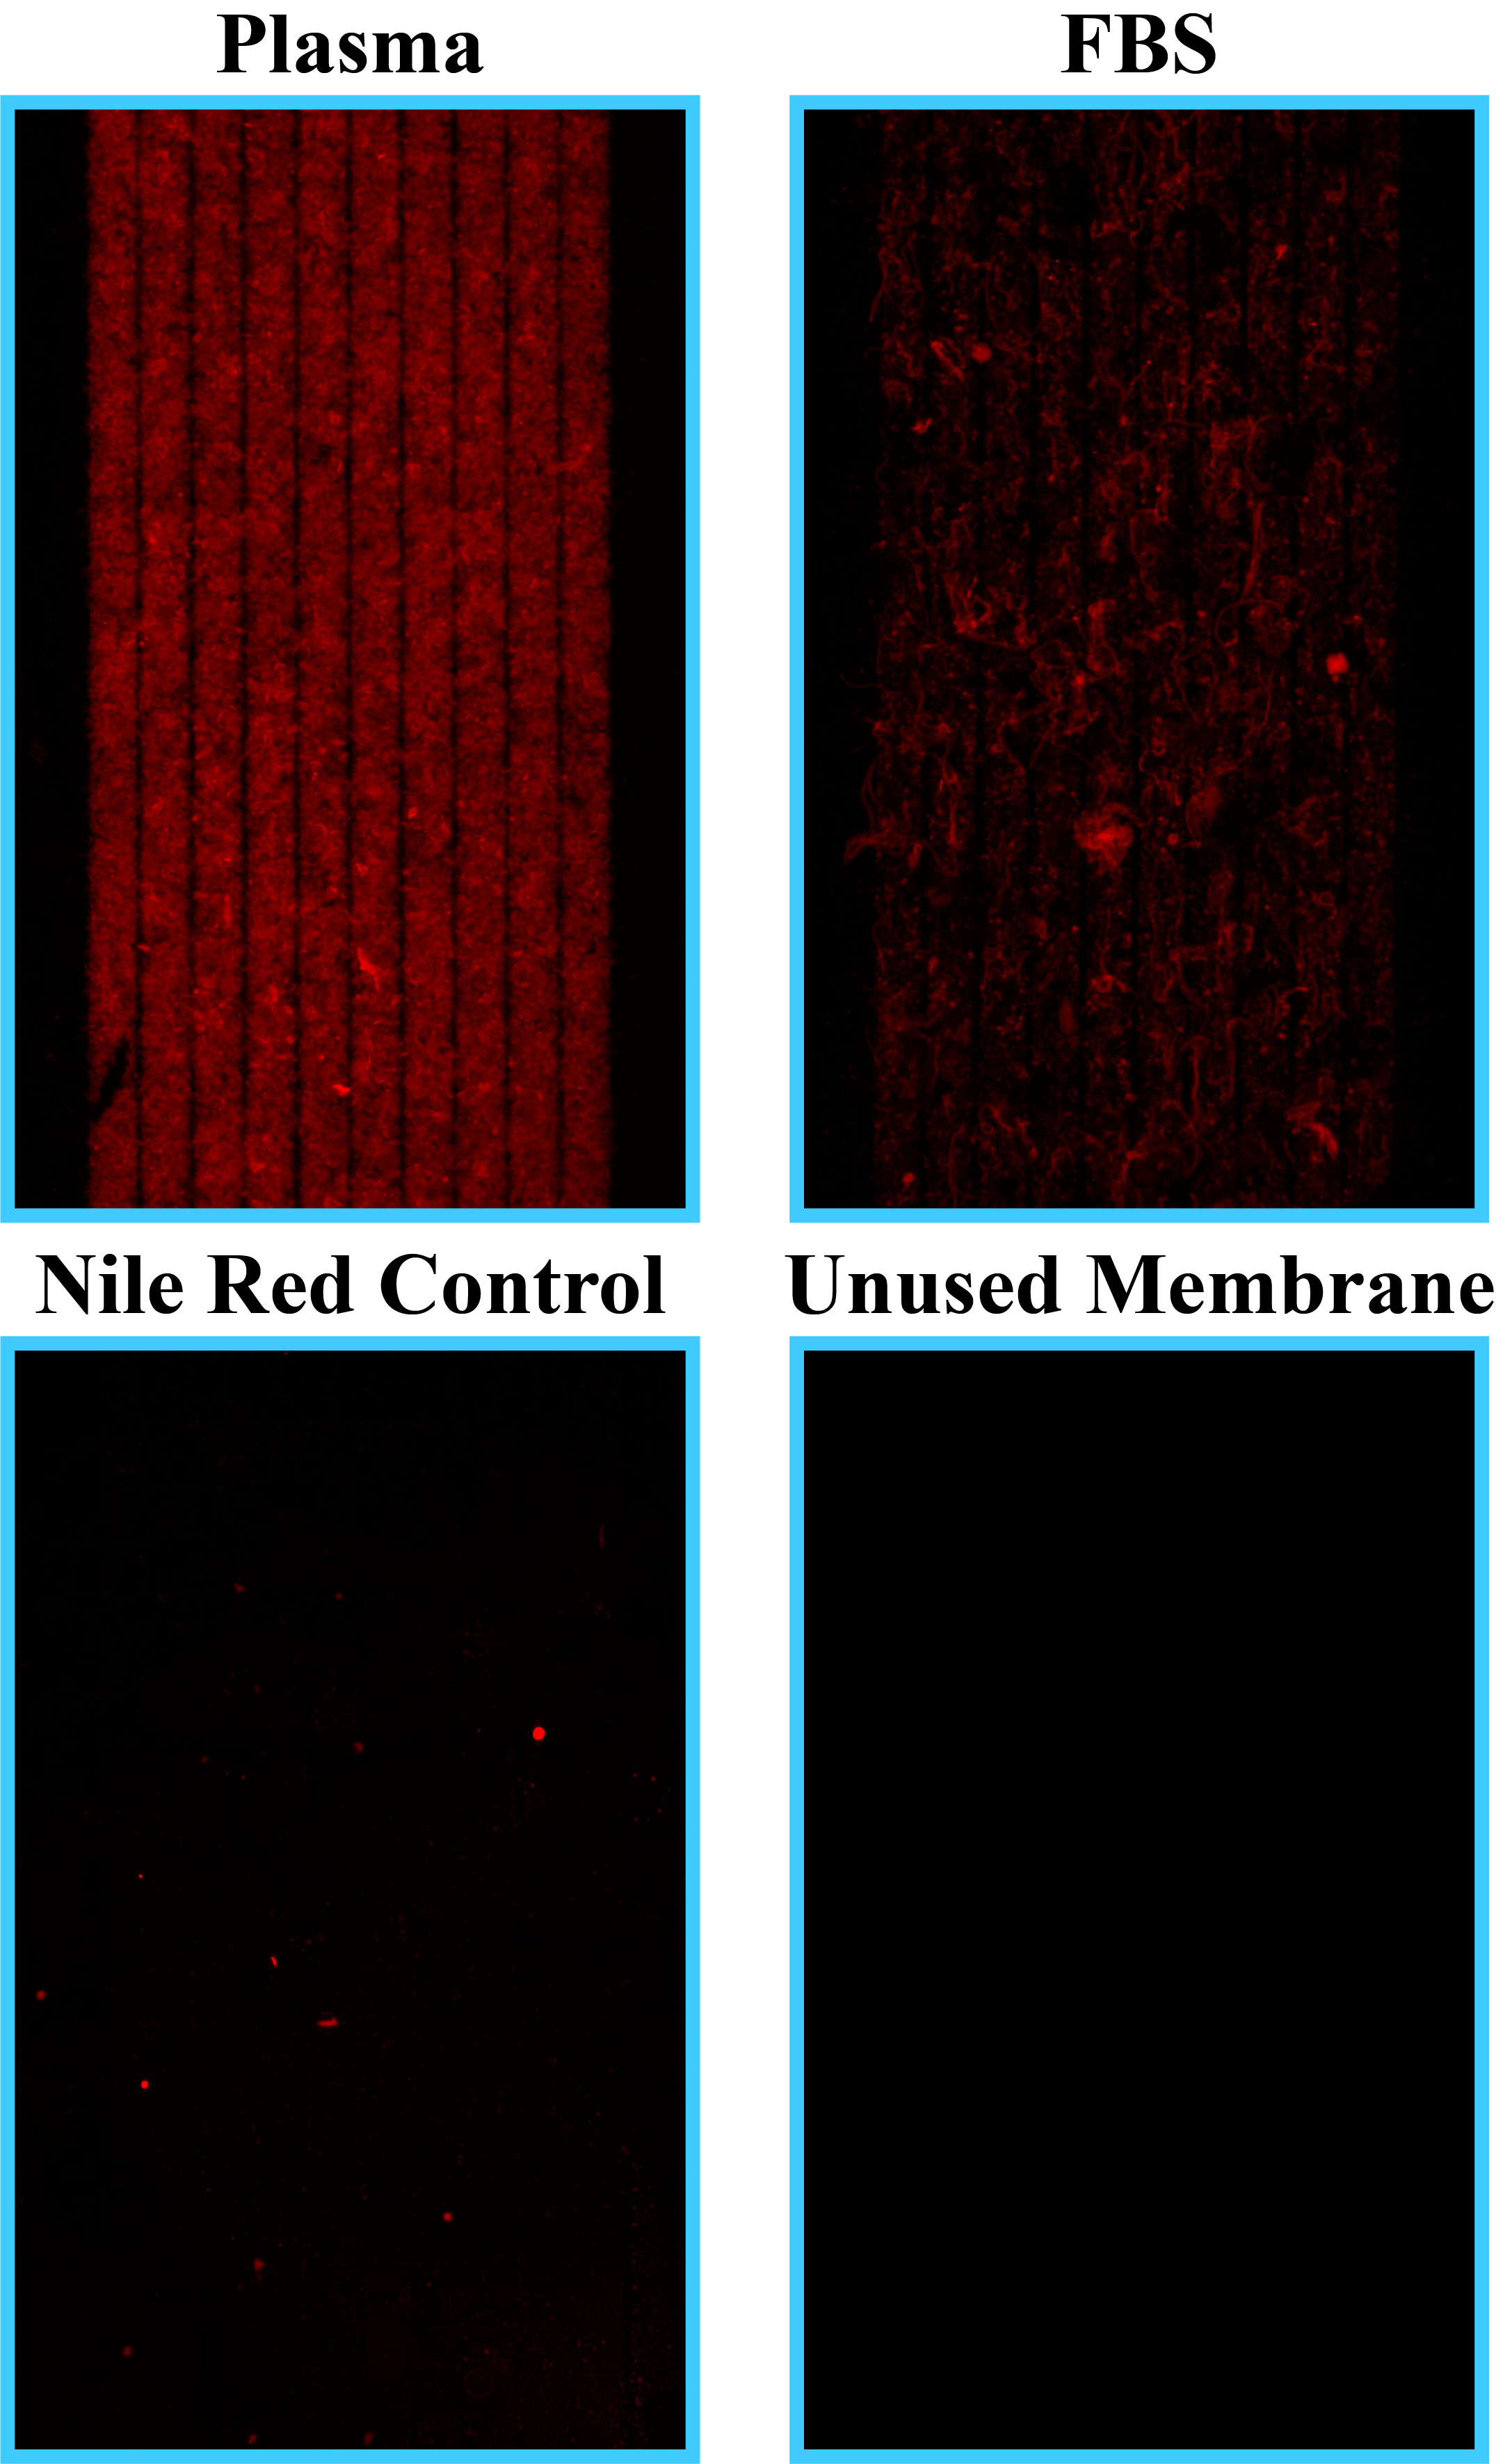
Control images (bottom panels) indicate that the membrane surface does not contribute to considerable fluorescence staining (bottom left panel – Nile red-spiked ethanol) nor provide any appreciable background (bottom right panel – unused membrane). Plasma presents a strong fluorescence signal across the entirety of the membrane while FBS resulted in a sparser fluorescence signature corresponding to a dense layer and streaky deposits residing on the membrane surface, respectively.
The contrast among fluorescence signals could in part be due to the difference in total lipid content amid blood constituents; plasma and FBS present 4.7 mg/mL and 1.8 mg/mL of total lipid content, respectively. It is also important to note that Nile red can serve as a probe for hydrophobic surfaces of proteins including albumin [7]. This means the discrepancy in staining could also arise from disparity among the most abundant protein species: ranging from 35-50 mg/ml in plasma and 20-36 mg/ml in FBS. Even though there is far more protein in each blood constituent, compared to their respective lipid classes, the spectrofluorometric properties of Nile red vary depending on the hydrophobic target; it has been shown that Nile red exhibits a relative fluorescence intensity that is ten-fold higher when comparing very-low-density (VLD) lipoproteins to albumin [8]. Furthermore, the cutoff emission filter utilized (600 nm) provides better “viewing” conditions for lipoprotein classes over protein classes considering emission maxima of ~600 and 640 nm, respectively [8].
In light of all these results, many scenarios could unfold during plasma filtration. First, it is possible that membranes struggle to clear specifically lipid components from the feed solution or that there is some propensity for lipid adsorption that results in extensive fouling and pore occlusion. In this scenario, after lipid content has formed a cake layer the entirety of the protein population in plasma is deposited which would explain the SDS-PAGE results indicating that the layer resembles a whole plasma sample. Another possibility is that the considerable heterogeneity of plasma overwhelms small-area membranes; this is in part supported by recent work with lift-off membranes [9]. Lift-off membranes were able to perform clearance on a plasma surrogate for multiple hours without succumbing to the fouling; the marked difference in behavior can be explained by the degree of burden placed on each membrane. If we consider a burden factor calculated as the ratio of ultrafiltration conditions to membrane area [(Qu/Qs)/Area] there is a factor of 1000 discrepancy between experimental procedures. It is, therefore, possible that if the membrane area was increased to a suitable range, the experiments in this work could be successfully conducted unaccompanied by the reported fouling phenomenon.
Moving forward, a number of avenues could be explored. Foremost, to process raw biological samples membranes will likely require a substantial increase in active area and/or surface modification such as a PEG anti-fouling coating/applied surface charge. Alternatively, more investigation could be completed to determine if some components of biofluids have a tendency to initiate fouling; the lipoprotein class could be an initial candidate. It would be interesting to see if plasma was more workable after lipoproteins/microvesicles had been precipitated. As part of this future work, I have attempted coating membranes with KODE-PEG as well as using a modified device design that incorporates all three membrane windows. In both cases, cake formation still occurs indicating that more alterations are necessary. It is important to reinforce that while these experiments are not sustainable for a prolonged treatment such as HD, workable volumes of filtrate are generated. This means further analyses could be carried out on filtrates to determine “filtration loss” and elucidate differences between stock and filtered plasma.
References
[1] Polaschegg, H.-D. (2009). Red Blood Cell Damage from Extracorporeal Circulation in Hemodialysis. Seminars in Dialysis, 22(5), 524–531. https://doi.org/10.1111/j.1525-139x.2009.00616.x
[2] Stamopoulos, D., Bakirtzi, N., Manios, E., & Grapsa, E. (2013). Does the extracorporeal circulation worsen anemia in hemodialysis patients? Investigation with advanced microscopes of red blood cells drawn at the beginning and end of dialysis. International Journal of Nanomedicine, 8, 3887–3894. https://doi.org/10.2147/ijn.s49845
[3] Hakim, R. M. (1993). Clinical implications of hemodialysis membrane biocompatibility. Kidney International, 44(3), 484–494. https://doi.org/10.1038/ki.1993.272
[4] Costa, E., Rocha, S., Rocha-Pereira, P., Castro, E., Miranda, V., Faria, M. S., Loureiro, A., Quintanilha, A., Belo, L., & Santos-Silva, A. (2008). Changes in Red Blood Cells Membrane Protein Composition during Hemodialysis Procedure. Renal Failure, 30(10), 971–975. https://doi.org/10.1080/08860220802422036
[5] Peuchant, E., Salles, C., Vallot, C., Wone, C., & Jensen, R. (1988). Increase of erythrocyte resistance to hemolysis and modification of membrane lipids induced by hemodialysis. Clinica Chimica Acta, 178(3), 271–282. https://doi.org/10.1016/0009-8981(88)90235-5
[6] Chiangjong, W., Changtong, C., Panachan, J., Weeraphan, C., Srisomsap, C., Hongeng, S., . . . Chutipongtanate, S. (2019). Optimization and Standardization of Thermal Treatment as a Plasma Prefractionation Method for Proteomic Analysis. BioMed Research International, 2019, 1-11. doi:10.1155/2019/8646039
[7] Sackett, D. L., & Wolff, J. (1987). Nile red as a polarity-sensitive fluorescent probe of hydrophobic protein surfaces. Analytical Biochemistry, 167(2), 228–234. https://doi.org/10.1016/0003-2697(87)90157-6
[8] Greenspan, P., & Fowler, S. D. (1985). Spectrofluorometric studies of the lipid probe, nile red. Journal of Lipid Research, 26(7), 781-789.
[9] Miller, J. J., Carter, J. A., Hill, K., DesOrmeaux, J.-P. S., Carter, R. N., Gaborski, T. R., Roussie, J. A., McGrath, J. L., & Johnson, D. G. (2020). Free Standing, Large-Area Silicon Nitride Membranes for High Toxin Clearance in Blood Surrogate for Small-Format Hemodialysis. Membranes, 10(6), 119. https://doi.org/10.3390/membranes10060119