Membrane impact on diffusion
Follow up to this post. As a brief reminder, I have performed 3-D simulations of separations in large and small volume systems. I have defined an effective diffusion coefficient that takes into account the membrane hindrance and compared this to free diffusion. As the Deff/D0 ratio drops, this means the membrane has a higher impact on the separation. Here I show a batch of simulations comparing different time scales and volumes:
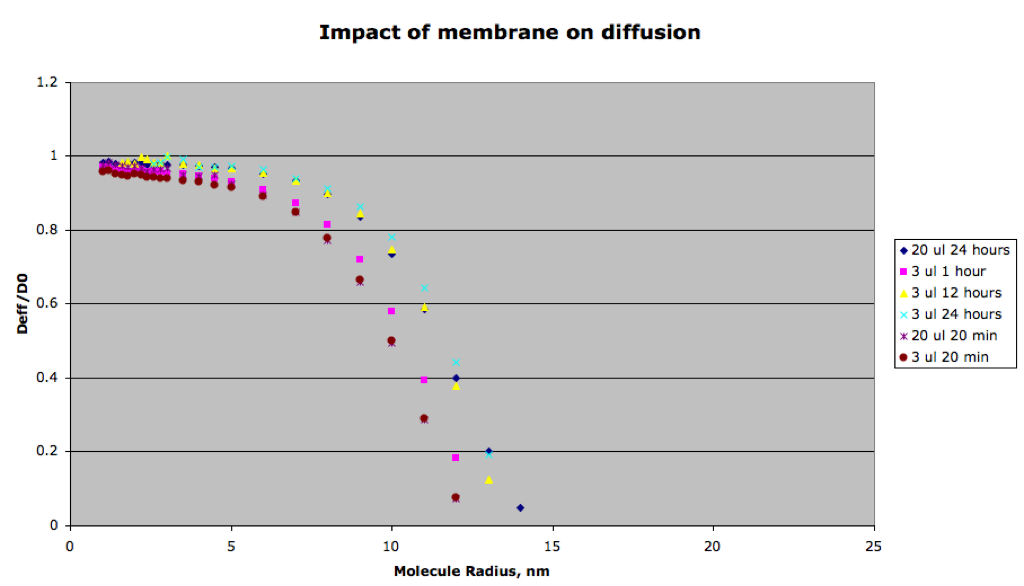
Now here’s what I get out of all of this. The low volume simulations (3 uL on each side) are similar to the high volume simulations (20 uL on each side). The low volume solutions hit equilibrium quicker, but it doesn’t appear that the membrane has more of an affect on the separation characteristics than it does for the large volume systems at the same time points. This means that the intrinsic diffusion coefficient of the molecules drives the separation more than the membrane no matter the volume of the system.
Time however makes a big difference. The membrane has the biggest impact on the separation at short time periods. The membrane hinders larger molecules more over short time scales. This points to the benefits of stirring or counterflow as a method to achieve the biggest contribution from the membrane in the separations.
Coming up next: How much does pore morphology/porosity affect the effective diffusion coefficients? What about a 1D simulation?
UPDATE: Synthetic membranes
For this simulation, I’ve designed a series of fake membrane with monodisperse pores. Two have 20 nm diameter pores, one with 5% porosity and one with 1%, and two have 10 nm pores, again with 5% and 1% porosity. I followed the same method to find the effective diffusion coefficient for these simulations and plotted that against size.
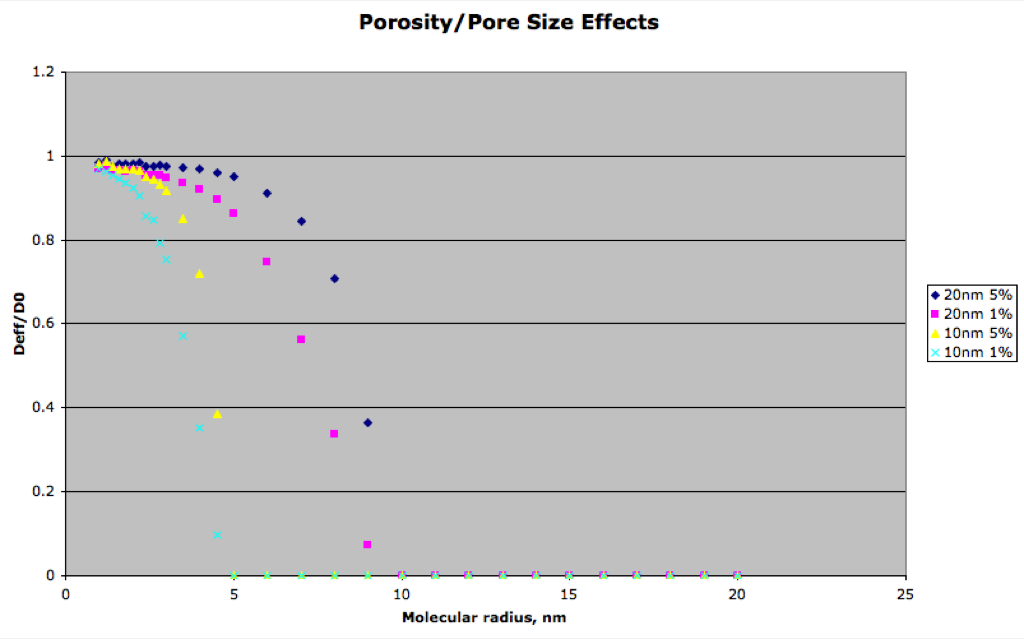
The cutoffs are obvious in this plot due to the monodispersity of the pores. Lowering porosity does increase the importance of the membrane as does lowering the cutoff. The changes are much more visible in this figure.
I’m having trouble understanding this. How are you calculating the diffusion constants at specific times? I’m getting confused by the time-dependent diffusion constant concept. Thanks.
So there are really two benefits to stirring to prevent the establishment of long-distance gradients. The first and most obvious one is that it speads up the transport because it maximizes the concentration jump. The second, shown here, is that it keeps the system as far from equilibrium as possible and maximizes the hindrance of large molecules relative to small ones thereby making the membrane more effective.
Chris,
I run a series of simulations (some with membranes and some without) for different sized molecules. I then determine the filtrate to retentate ratio at a given timepoint for these simultations. Basically this means I check how much has diffused through at 20 minutes or at 24 hours.
I compare the ratio of simultations with membranes to those without and I try to find what free diffusion coefficient would give the separation I see in the membrane simulations. I call this the effective diffusion coefficient for the system with a membrane. I then compare these to the actual free diffusion coefficients given the size of the molecules, and finally plot the how much the membrane slows diffusion.
This strikes me as a complicated way to to express the hindrance of the membrane. Since this is a simulation, can’t you just look at the diffusive flux (net molecular transport or time rate of change of the concentration in each chamber) through the plane of the membrane with the membrane there and when it’s not there? This would be a direct measure of transport hindrance, right?
The evolution of the effective diffusion coefficient over time certainly is one way of showing the interplay of bulk and membrane diffusion, but it’s not clear to me why this construction was chosen. Is it used for another part of the simulation?
Yup I can also look at the flux. It can be readily integrated over the membrane slit using comsol.
I give the membrane a diffusion coefficient that is slower than free diffusion in my simulations, but this doesn’t affect the whole system much because the membrane is so thin. I think that’s why we were thinking about comparing diffusion coefficients. If we gave the whole system a diffusion coefficient and compared that to free diffusion we’d get some idea of how the membrane would affect the simulation.
However it’s probably easier to talk about flux. That will still be affected by the geometry to some degree also.
I understand. The thing that I don’t like about the effective diffusion coefficient is that it masks some of the important geometry-related and time-related effects, that have practical significance.
I understand what you are trying to do with the effective diffusion coefficient, but since it must have a time-dependence, it takes some of the beauty out of the concept. I’m sure it’s useful in certain contexts.
The flux is time dependent too. As the system approaches equilibrium the flux will slow down. We want the time dependent part anyhow to be able to say that at short times the membrane will have a bigger impact on the separations, thus making it important to stir the system or perform counterflow.
Because flux varies in direct proportion to the diffusion coefficient these ‘effective’ coefficients provide some intuitive feel for the results – even if the truth is more complicated than it seems at first glance. It is true that the values are time and geometry dependent, but molecular flux values are the product of a diffusion coefficient and the concentration jump which makes any results we report even more particular. Lets get this into manuscript form and rethink then.
I would still argue that a time dependence in a real physical quantity is more clear than a time dependent artificial construction. For example, from these plots I have no way of knowing if all the dynamics that are being plotted are taking place over a time period where <1% of the species are actually moving across the membrane. From the engineering perspective, I would not be very interested if we’re talking about tiny, heavily diluted separations. If there were a flux plot, I could see exactly what’s happening with or without the membrane there, and I could do a back of the envelope integration to determine how much material we are really talking about passing the membrane, and compare to the total volume.
I just don’t know what to do with the Deff plot other than look and see that the graphs are different. What do you guys look for and how do you decide if a difference is significant on these plots? Maybe when the paper gets written, it will be clearer to me.