Monitoring Diffusion to Equilibrium
In this post I show the sieving coefficients of simulations with a thin membrane, a thick membrane, or a no membrane case as they approach equilibrium. The simulations were carried out for 48 hours, and plotted for 1 hour time points. Both thin and thick membrane had the same pore distribution – monodisperse 10 nm radius pores at 5% porosity.
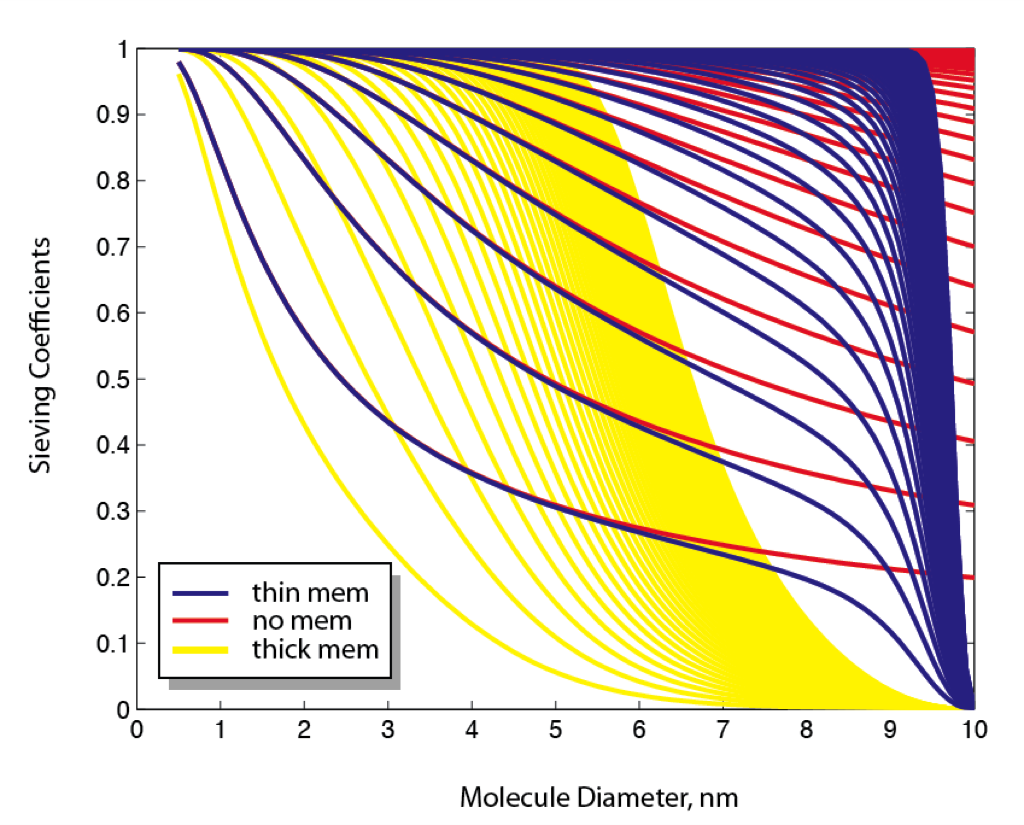
As time moves along, the sieving curves approach the cutoff. The thin membrane almost becomes a step function, and early timepoints are limited by the diffusion coefficients of the molecules. The thick membrane is not limited by the diffusion coefficients of the molecules, and never quite reaches the sharpness that the thin membrane does. Presumably given enough time, it too would reach the step function, however infinite time may be required to get that far. The thin membrane can reach a cutoff defined by the physical pores within a reasonable amount of time.
This figure is great. It answers every question that I’ve asked or heard others ask about diffusion through thick vs thin membranes…
Interestingly, you could argue that a thick membrane behaves like a chromatography column, with a cutoff that shifts over time. We are faster, but appear to be tied to the actual membrane cutoff.
I agree, this graph is very useful. It shows that at diameters equal to or less than 1/2 the pore size, there is no difference between our thin membrane or no membrane at all, a fantastic result!! This should find its way in a publication really fast! Great job, Jess