Burst Pressure
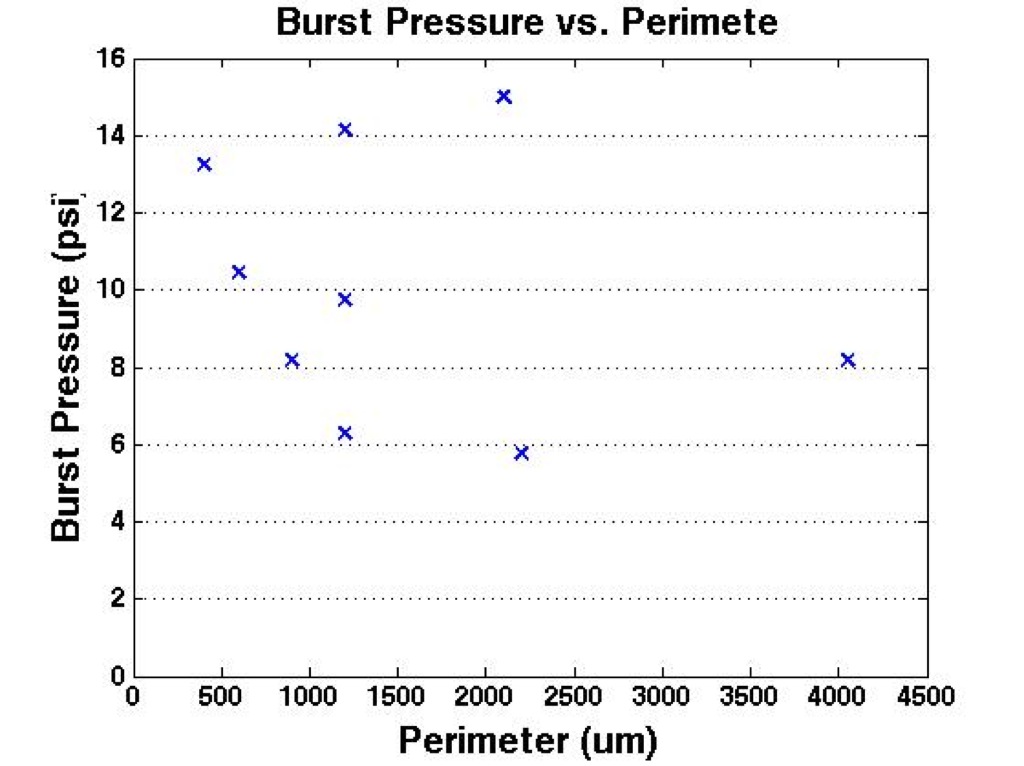
Josh and I are taking a closer look at how the samples burst and what different factors can affect the strength of the membrane. We are specifically looking at minimum dimension, area, and perimeter. A wafer was designed that contained different sized samples. One of the three factors were held constant while the other two factors were altered (ex. minimum dimension was held constant and the length was changed to change the area and perimeter). Four different samples were made for each different factor being held constant which gives a total of 12 samples with different lengths and widths. The wafer included samples with individual features that were used to measure burst pressure values and also samples with multiple features that were used just to determine which samples will break first and to determine if there is any trend.
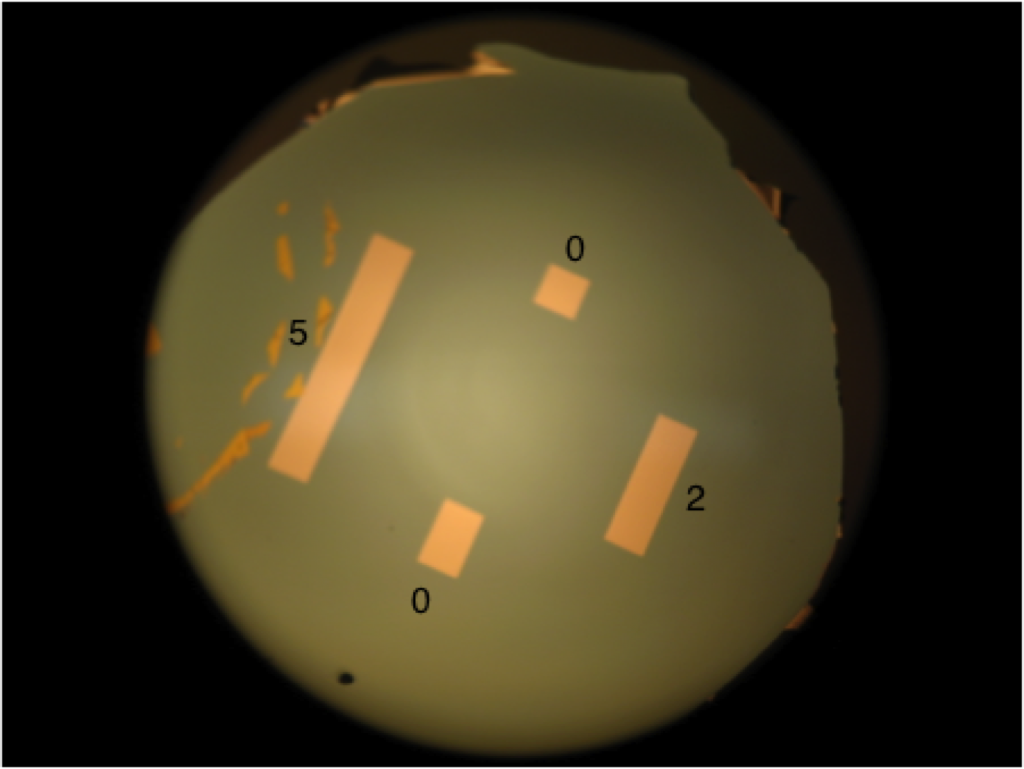
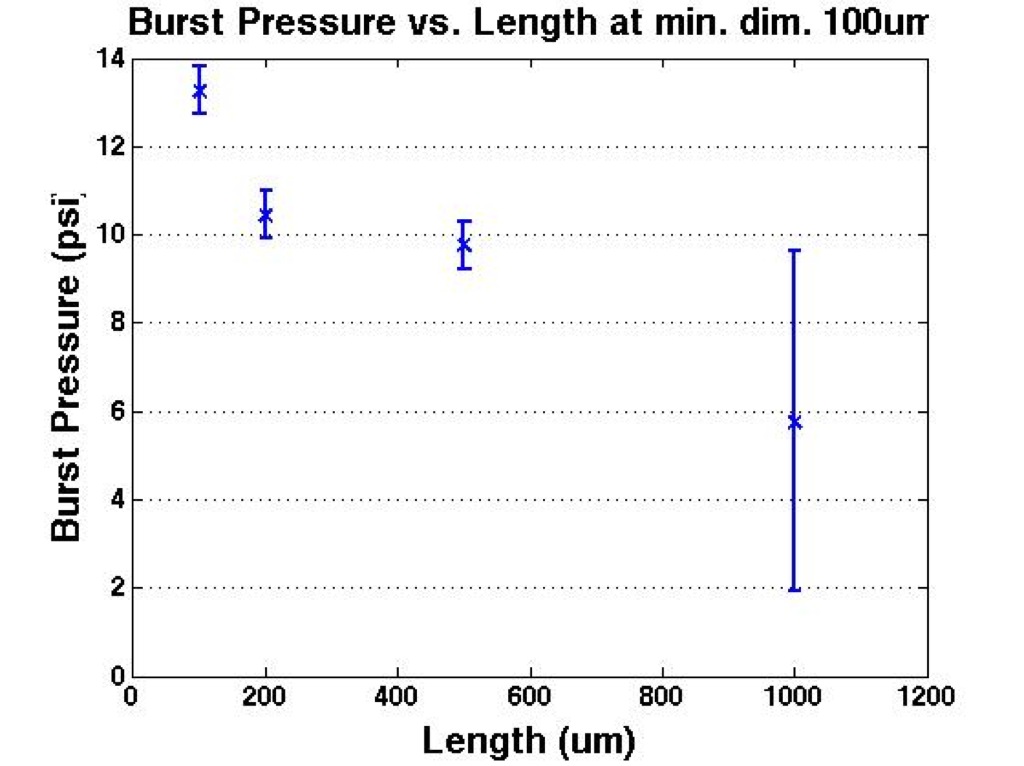
Minimum dimension held constant: (sizes: 100×100, 100×200, 100×500, 100×1000)
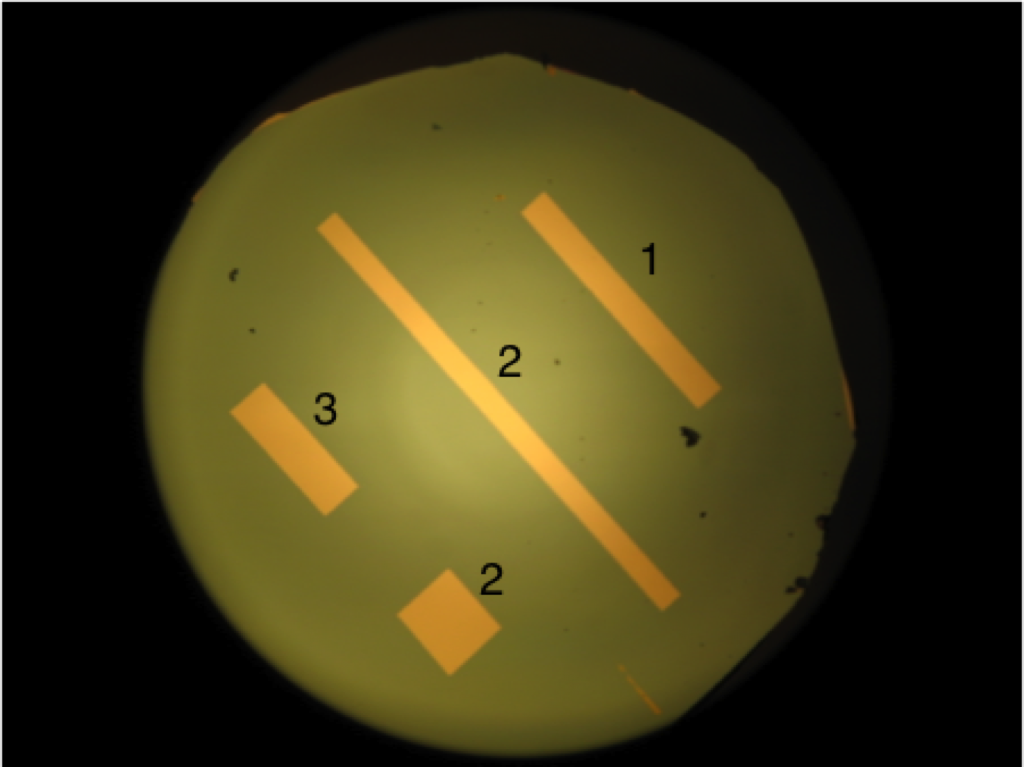
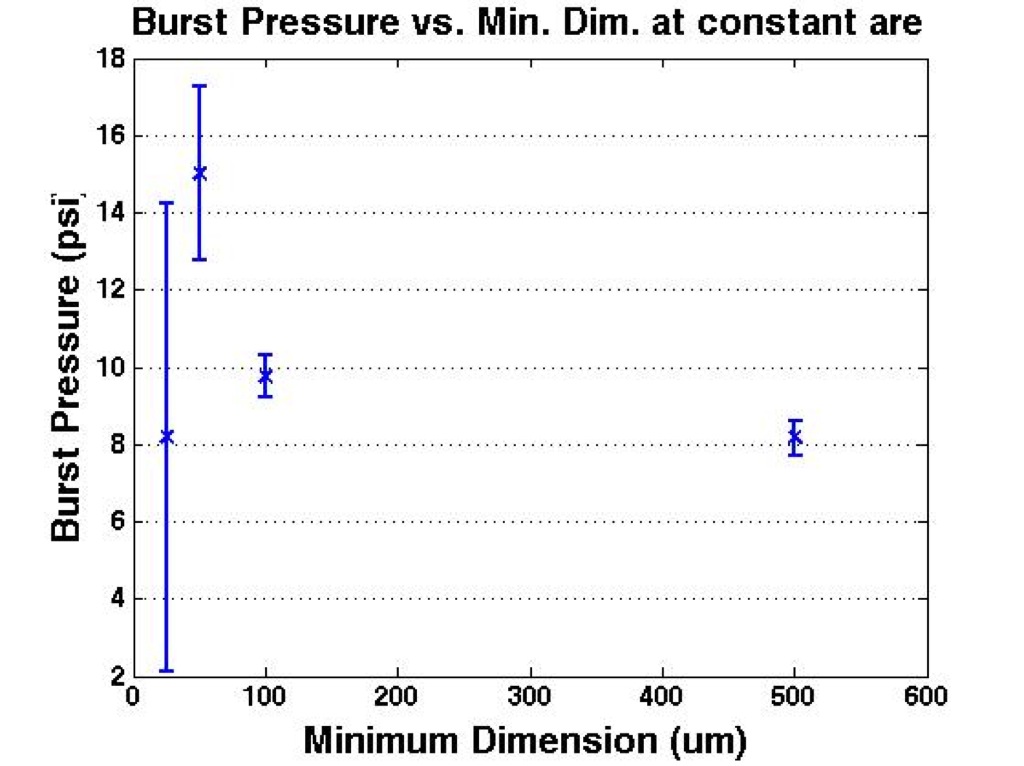
Area held constant: (sizes: 25×2000, 50×1000, 100×500, 200×250)
Perimeter held constant: (sizes: 50×550, 100×500, 200×400, 300×300)
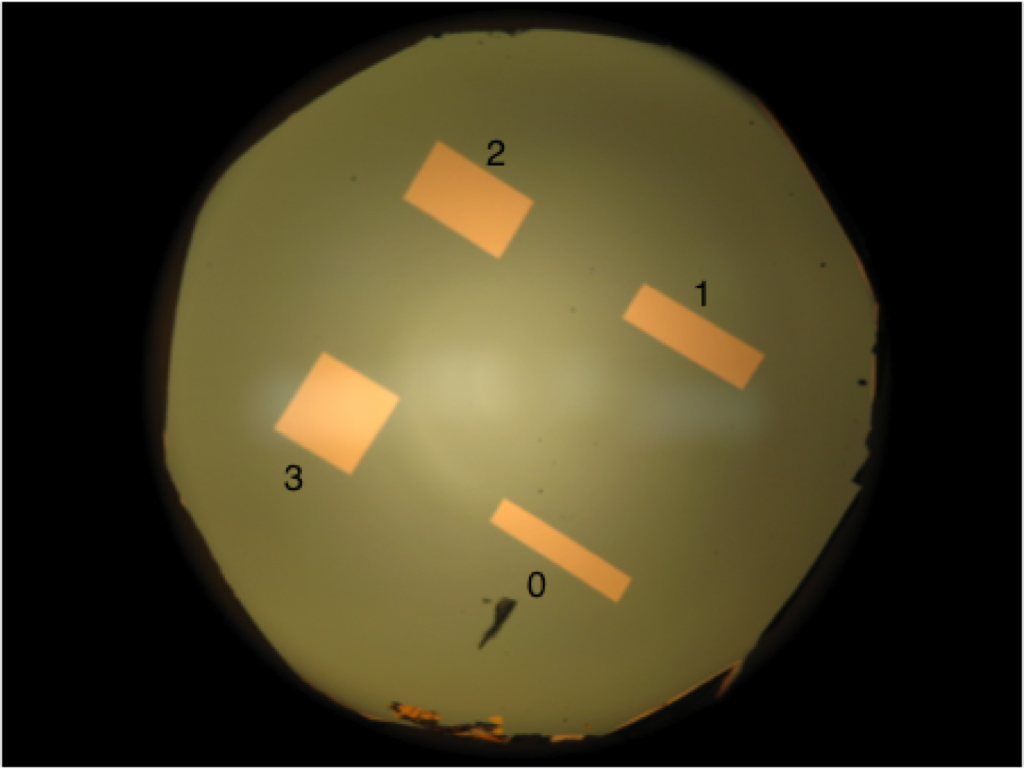
The number next to each of the features represents the number of times the sample broke first when pressure was applied.
The following are different graphs that represent the burst pressures values that were measured for single features:
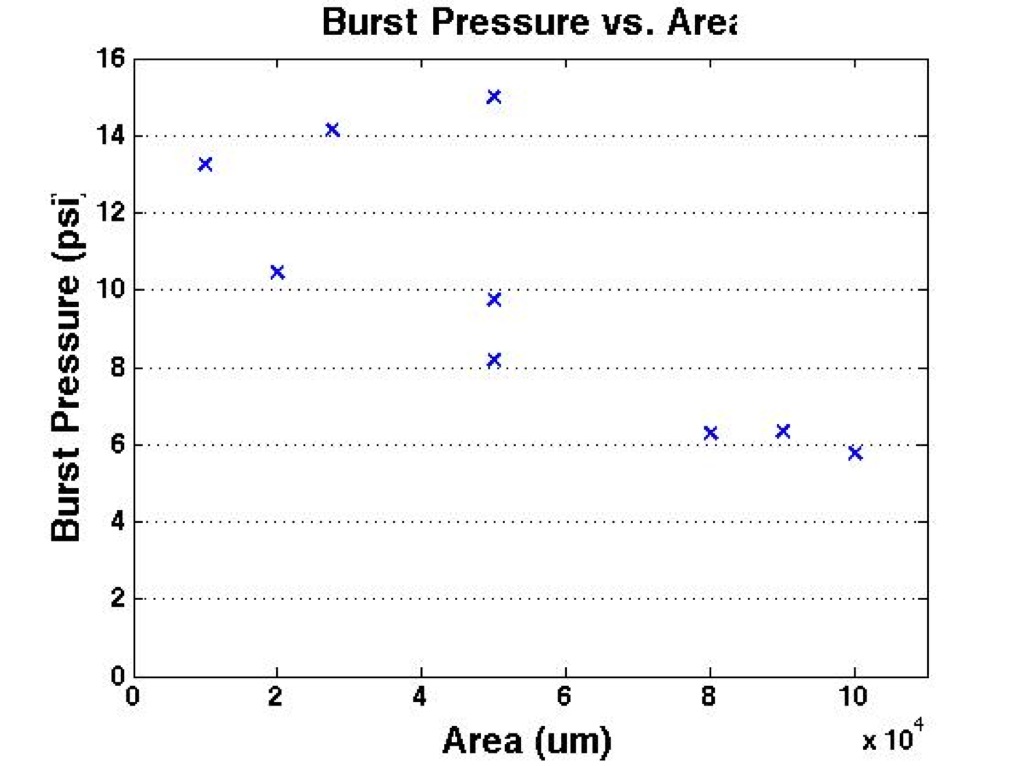
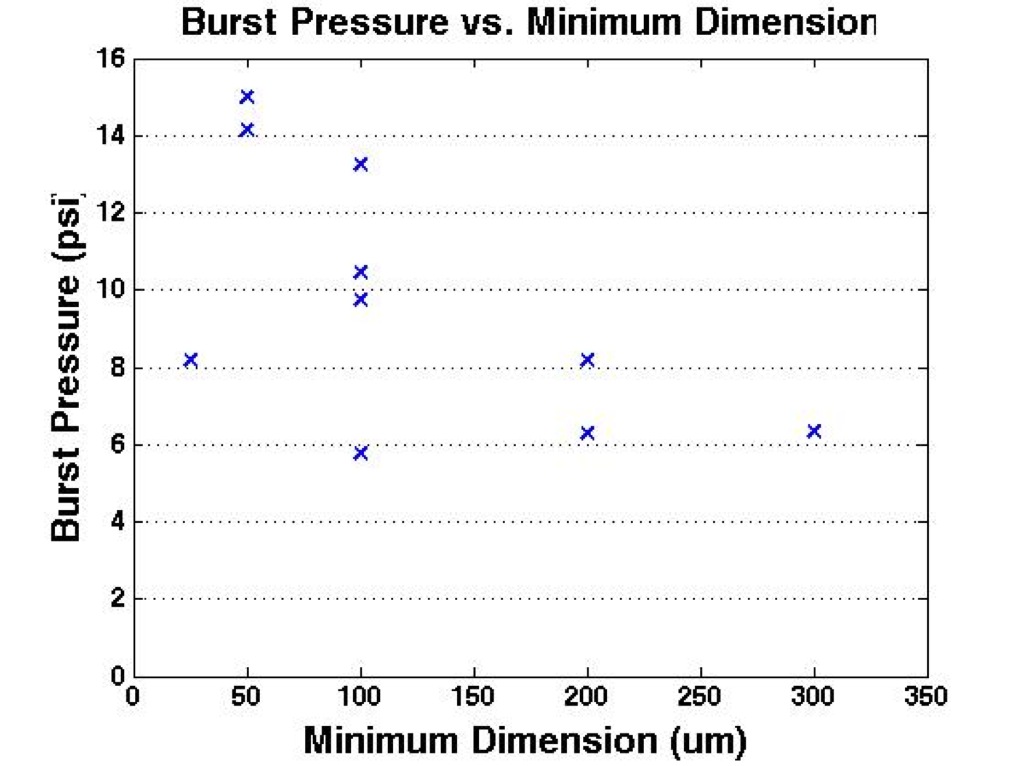
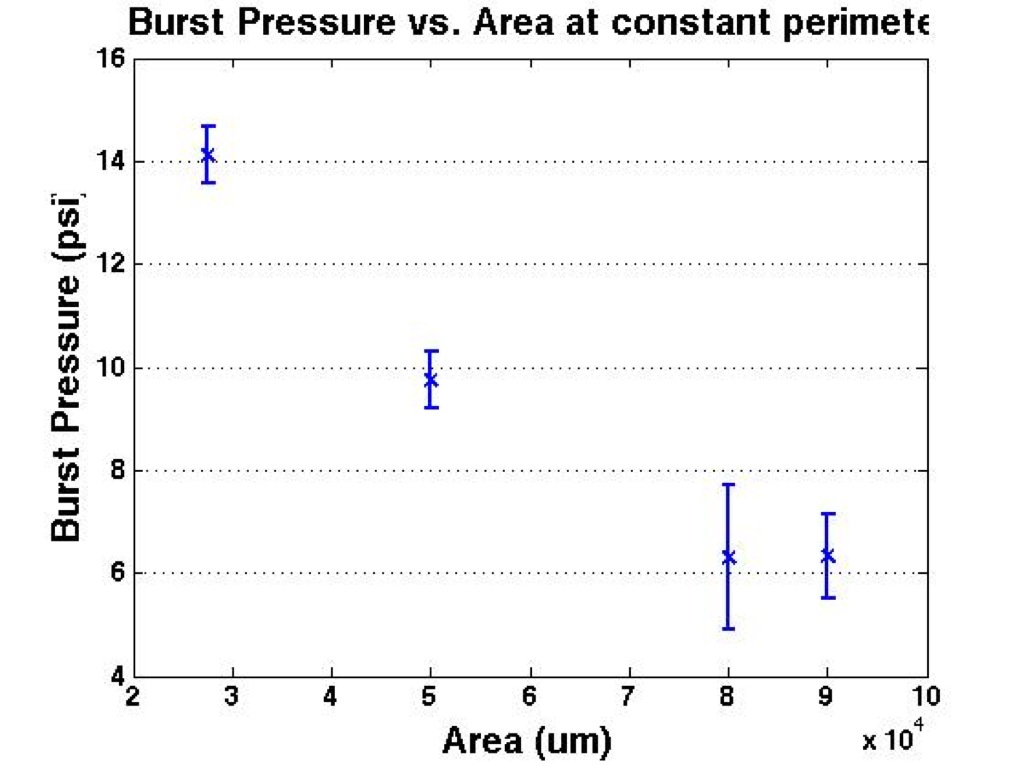
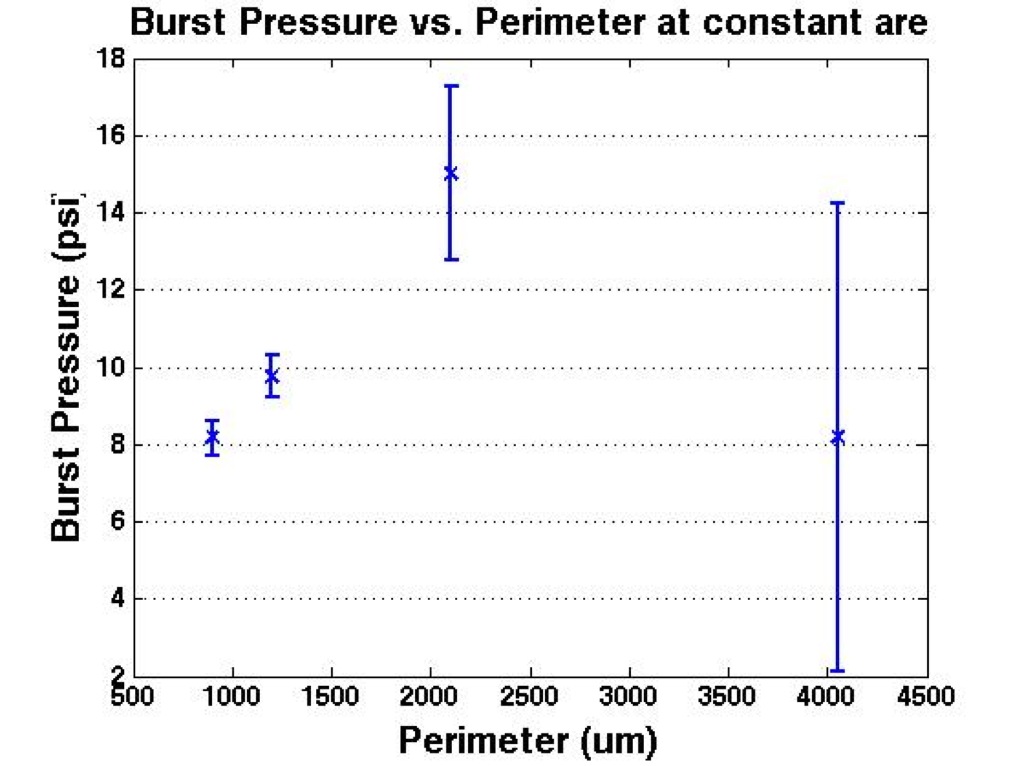
multiple features perimeter before and after pictures
multiple features minimum dimension before and after pictures
multiple features area before and after pictures
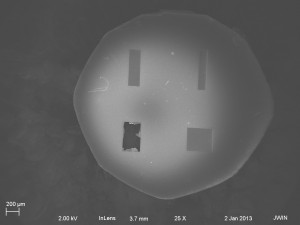
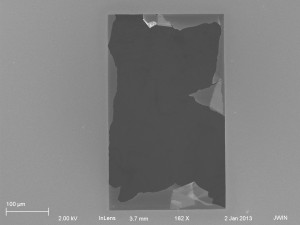
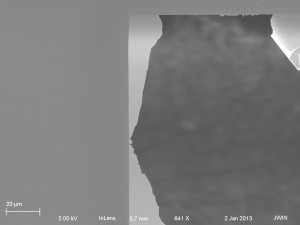
Below are some SEM images of a burst sample.
For each of the chip designs in the first part of the study, calculate the probability that particular membrane shapes would break if one of the two variables (not the one held constant) were the primary determinant of failure. So for the first chip with minimum dimension held constant you would calculate the total perimeter for all for membranes and then calculate probability for a particular shape based on the fraction of perimeter that that shape contributed to the total. Repeat for area.
We also need to get back to the mechanical equations and determine which shape is experiencing the maximum deflection on each chip.