Au separations with SiN-NPs
Ultimately we want to use SiN-NP filters to separate viruses or some other biological species, but repeated attempts to pass 20 nm fluorospheres in water or PBS have failed. Au particles, however, have passed through the filters. This post reports the results of Sarah and I attempting to pass Au particles from 20 to 100 nm diameters in water through SiN-NP 5-slot SEPCONs. We used the pressure cell with 2-5 psi to force flow though the filters. We started with 400 uL and stopped the flow once ~ 200 uL of filtrate acquired. Generally, this took 30 s – 300 s with the flow rate slowing as more solution was passed. Below is a table of the starting Au concentrations and the diluted concentration we used in this study.
| Dia. (nm) | Stock (NPs/mL) | 3 to 1 dilution |
| 10 | 5.70E+12 | 1.43E+12 |
| 20 | 7.00E+11 | 1.75E+11 |
| 40 | 9.00E+10 | 2.25E+10 |
| 50 | 4.50E+10 | 1.13E+10 |
| 60 | 2.60E+10 | 6.50E+09 |
| 80 | 1.10E+10 | 2.75E+09 |
| 100 | 5.60E+09 | 1.40E+09 |
Below is a plot of the size distribution by intensity for the 3 to 1 diluted Au solutions as measured by the Malvern.

The cuvettes used for the Tecan and Malvern are pictured below. We used both cuvettes for the same sample in the Malvern, and detected no difference. When measuring absorption with the Tecan, however, there is a significant difference between the baseline for each cuvette. We catalogued which cuvette was used for each sample and subtracted the baseline for water from each accordingly.

Karl and I discovered months ago that the cuvettes do not have the window in the correct location for the Tecan, so we created a spacer that is pictured below.

The spacer fits in the bottom of the cuvette holder and raises the cuvette.

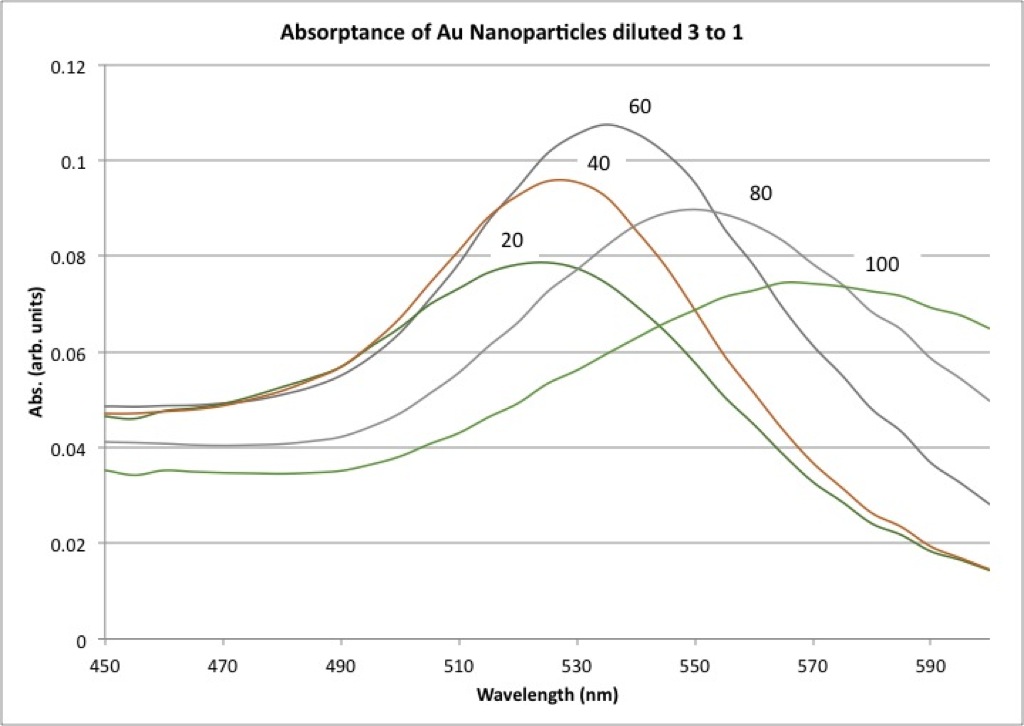
Below is a plot of the measured (and corrected for baseline) Au particles.
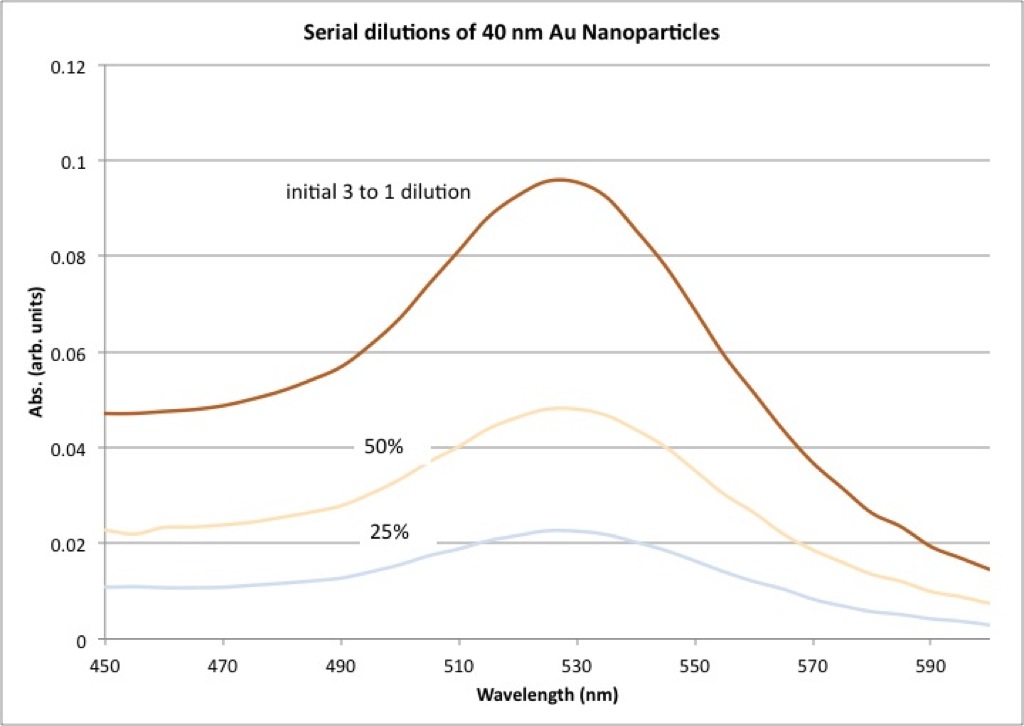
For reference, we did further dilutions of the 3 to 1 solution we used in the separations and plotted their absorptance below. We mixed up 50 % (1 to 1) and 25% (3 to 1).
We used the wavelength corresponding to the peak absorptance for each particle size to calculate the sieving (S = Cf/Co). The wavelengths chosen were:
| Particle (nm) | Wavelength (nm) |
| 20 | 525 |
| 40 | 530 |
| 60 | 535 |
| 80 | 550 |
| 100 | 570 |
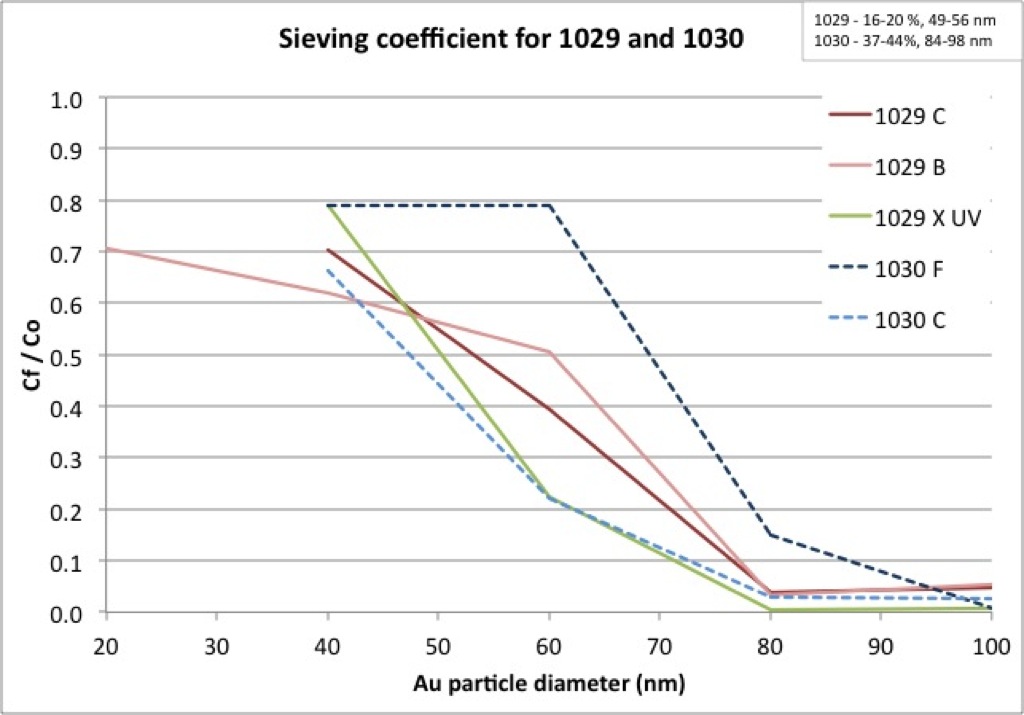
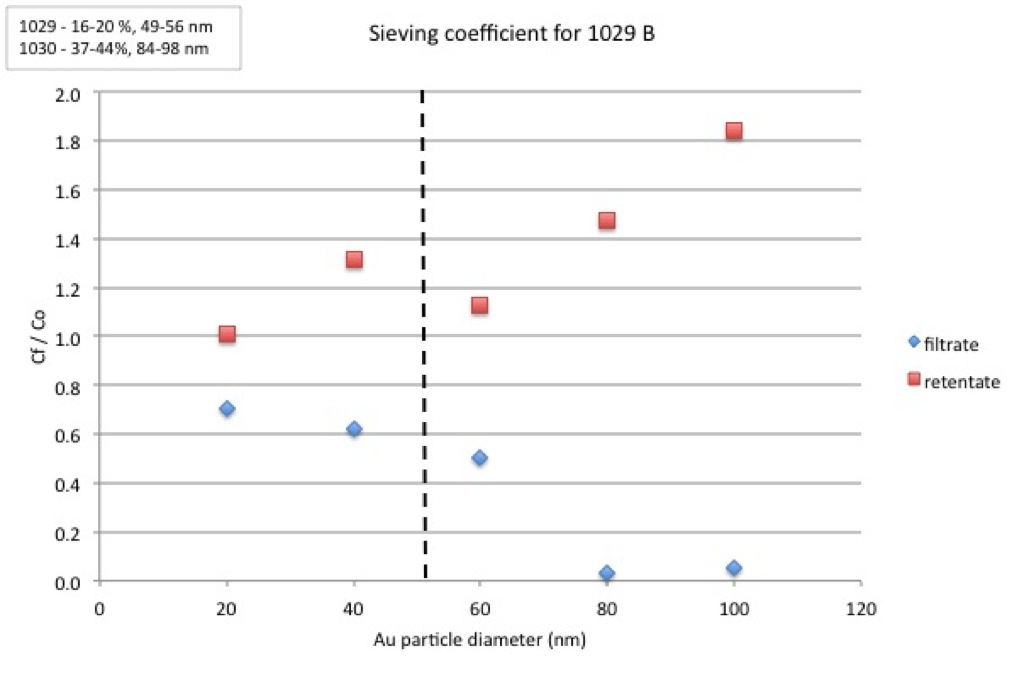
Following are plots of Cf/Co for three different types of filters. The differences between the filters are explained here, and the different porosities and pore sizes are in a text box in each image. The average pore diameter is approximated by the vertical dashed line in the plot. Each filter was tested with water before any gold separations were attempted. The order of separations for 1029 B was 60, 80, 40, 100, 20 nm. For the rest of the samples we generally started with the largest size and proceeded towards the smallest.


Here we compare only the filtrate of all of the samples we tested. Generally speaking, there is not much of a difference in cutoff between 1029 samples with or without the pnc-Si. While one 1030 chip is allowing larger particles to pass, the other is not. This data is a little disappointing because we were hoping to see a more significant difference in cutoff between the 1029 and 1030 samples given their respective difference in pore size. I plan to look at all the of SiN-NP samples using URnano’s TEM to get better quality images. Perhaps we will see a difference in the pore size/porosity between the TEM and the STEM images.
I was pretty frustrating while getting this data because it was painting the pretty picture I expected, but looking at this final plot I think we can say that the SiN-NP membranes are behaving consistently. They are also proving very durable and fast. Multiple separations on one chip, totaling roughly 1 mL of flow taking a total of ~10 minutes. Not too shabby.