Semi-Quantitative Analysis of Optical Transparency 3µm Porous Membranes
After seeing in previous posts how optically transparent the SiO2 membranes are, I went about seeing if I could quantify this in comparison to the SiN membranes and also CoStar PET track-etched membranes. In order to do so, I ‘seeded’ red 1µm beads (in 1X PBS) onto each type of membrane (the SiO2 and SiN membranes being in single-well CytoVu devices). These sat and settled over the course of about a week or so after initial seeding, to allow for beads to be on top of the membranes instead of floating around or sitting underneath the membrane.
I took images in phase and fluorescence to make sure I wasn’t counting beads that were on top of pores (since this wouldn’t help in determining the material’s relative transparency). ImageJ was used to measure the intensity of each bead determined to be on top of the membrane, and these values were inputted into an Excel sheet to calculate averages.
This is an example of the combined image for a track-etched membrane:
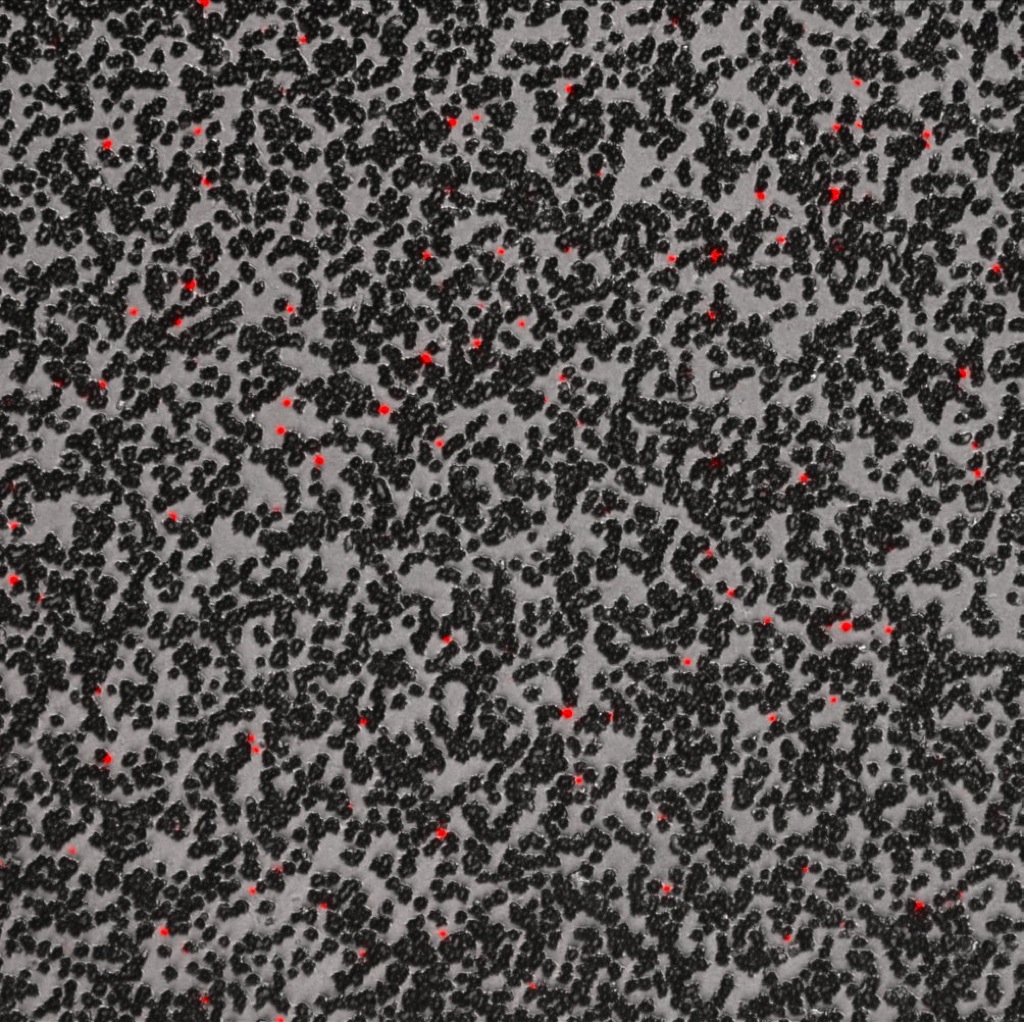
The resulting data gave an arbitrary fluorescent value of 5998 to the SiO2 CytoVu (with a max value of 16383). This was higher than both SiN (3958) and track-etched (5160), falling in line with previous observations. Average values taken were the result of measuring either 73 (SiO2), 93 (TE), or 148 (SiN) distinct beads
However, these numbers also imply that TE membranes are more transparent than the SiN membranes, which was contrary to assumption and intuition. It may be that some beads were detected as having leaked through the pores, or that conglomerates of beads formed, resulting in a higher fluorescent signal. The beads were sonicated and vortexed prior to use, but perhaps repeating each of these steps more times would be beneficial to isolating singular beads. Also, using beads that are larger (possibly 2µm, or even some larger than the pores) could assist in more accurate measurements.
I would like to repeat this with different beads and a fresh set of membranes. If possible I would prefer to simply have small nonporous sheets of identical material (like used for the SiO2 membrane) to ensure that all beads are on top. In lieu of this, I will attempt again with solely larger beads to gain more solid data.
9/12 UPDATE: After double checking this data, it does appear that there was one bead that had a reading of 16383. Only one instance occurs, and it is under the Track-Etched column.
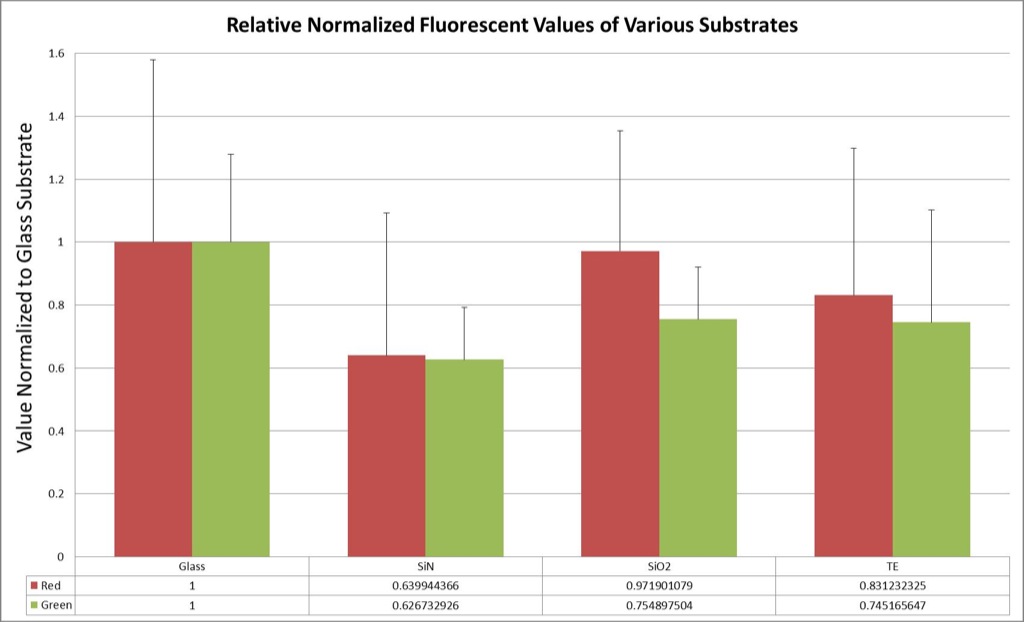
9/23 UPDATE: I did some tests with green beads, and after some initial data that seemed out of line, I got some workable information, as well as a bar graph of the data for red and green beads both. The two colors are normalized to their respective glass values, but not to each other.