The development of the μSiM-DX has been swift and focused, as discussed in these previous blog posts: https://trace-bmps.org/beadazzled-laying-the-foundation-of-the-%ce%bcsim-dx-fouling-based-sensor/ and https://trace-bmps.org/vindictive-virus-capture-testing-the-%ce%bcsim-dx-with-vaccinia-virus-towards-a-modular-virus-diagnostic/. To provide a greater understanding of the inner workings of the device, I have done a few calculations regarding some of its working properties related to microfluidics. The three I present here are about the relationship…
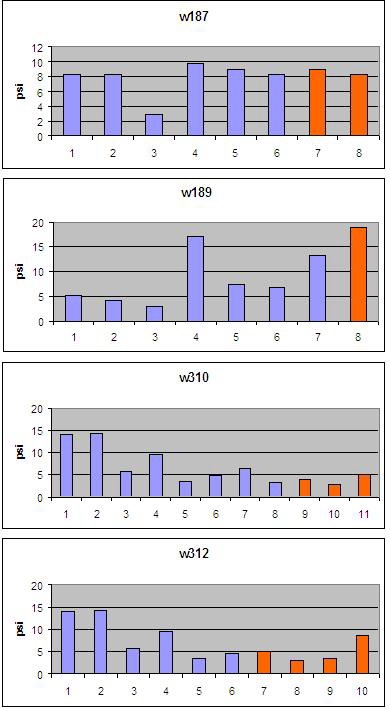
Thanks Maryna. I’m glad to see that we are breaking the 10 PSI barrier again!! Do the numbers on the x-axis correspond to position on the wafer? I assume the the stronger samples are from the center, where the porosity is lower?
Please let us know. Thanks!!
X-axis numbers don’t correspond to position but most of the “over 10psi results” are form the samples close to the center or in the center.
Maryna,
Could you label where the samples came from? It would be nice to see a trend based on the location from which the membranes came from!