Back in November we were visited by Tom Berkelman of BioRad to see if he could use our NPN membranes to successfully separate some proprietary nanoparticles from IgG in a solvent with secret ingredients. These particles have an interesting absorbance spectrum as well as strong fluorescence.
During that visit and in subsequent separations in the McGrath lab and at BioRad, we clog the membrane after passing only 20-30 µL. This occurs at concentrations of 0.1 mg/mL and higher, when using the constant pressure setup. Lower concentrations seem to allow greater total volume to pass through the filter, but clogging still occurs. We want to find a way to use our membranes to filter solutions with particles/protein at higher concentrations.
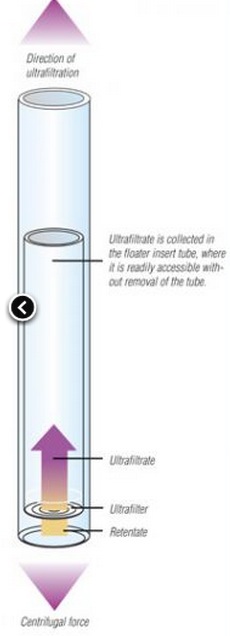
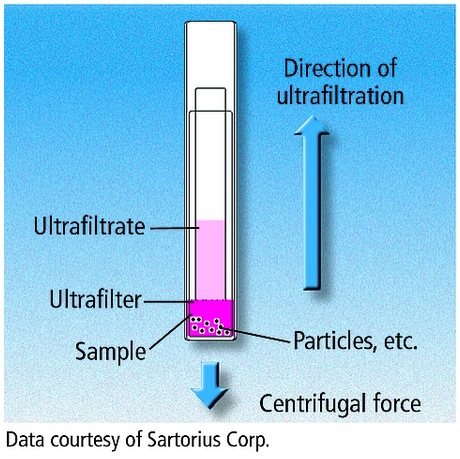
One hope we have of addressing this clogging is a “reverse” centrifuge technique. When Tom originally visited us on 11-20-13, he made mention of the Sartorius Centrisart
The centrifugal force acts to equilibrate the solution levels inside and outside the inner tube. This drives solution through the filter while also driving larger particulates away from the filter towards the bottom of the centrifuge tube. In this configuration, blocked particles should be less likely to stay at the filter and clog flow.
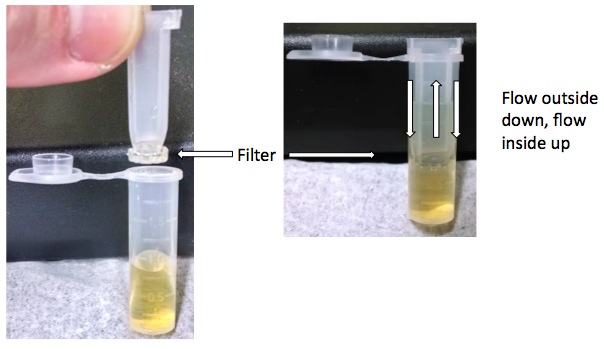
Jim suggested we try a similar approach using our Gen2 SepCon assemblies. The attached figure below
Gen2 Sepcon placed into 2 mL tube
shows the Gen2 being used with a 2 mL centrifuge tube. We tried Gen2 because it has a narrower profile and allows for more volume (~150 µL) around the side than the Gen3 tubes.
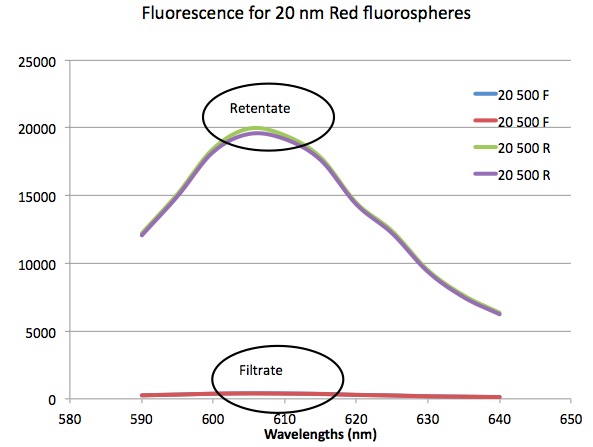
I started by testing a mixture of 500 nm yellow fluorospheres and ~20 nm red fluorospheres in 1X PBS. I diluted each stock 100 to 1 by volume. I believe this corresponds to 3 E9 particles/mL of 500 nm and 5 E13 particles/mL of 20 nm. This mixture has typically blocked flow through a membrane after ~30 µL of flow. I started the centrifuge at 2krpm for a series of 1 and then 5 min runs. There was very little if any flow visible. Maybe 20 µl. I upped the rpms to 3 k for 5 mins, saw a little flow. Then added 5 min at 4 krpm. At this point approximately ~100 µl of filtrate had been collected. Next I increased the rpms to 5k with continued success for 10 minutes. The membrane broke at 6 krpm. Little to no red or yellow particles seemed to have made it through the filter, as seen in the attached fluorescence plots.
I replicated the above test using two mixtures of materials Tom B. left after his visit. BR1 is combination of 1500 µl PBS/fairy dust + 15 µl 10mg/ml IgG + 150 µl “T24”.
BR2 is 1500 µl PBS/fairy dust + 15 µl “25b”.
“T24” is a particle prep that creates particles with ~32nm diameter at 122 ppm.
25b is “unfractionated IgG conjugation reaction” antibody to particle ratio 2:1. 524 ppm particles, 1.05 mg/ml IgG.
Both had 100 ul or more pass through the membrane to the 20+ 500 nm solution discussed above. I’ve attached the measured absorbance and flourescence data showing little to no particles passing through the membrane while at least some IgG has passed through. No IgG seems to have passed through in the BR2 test. (Or the concentration may simply be too low to measure using the nanoquant plate.)
BR 1 absorbance showing T24 absorbance peaks at ~325 and ~460 nm.
BR 1 fluorescence
BR 2 absorbance
BR 2 fluorescence
I think these positive results merit further study. Immediate actions might be to modify the current 2 ml centrifuge tubes so that less total volume is required. Currently we need at least 1.5 ml. If we fill the bottom of the tube with PDMS for example, we might only need 0.5 ml.
We should also repeat these experiments with higher concentrations of IgG and particles.
(In a parallel effort, we recently purchased some Labview microfluidics equipments to drive filtration with a syringe pump while monitoring the pressure building up behind the membrane.)
I have a couple questions: Does anyone know of a stock of open bottom pieces for the Gen2 assemblies? I have many of the closed versions, which are not ideal for this test.
I believe I need to use 100 um gasket material for the Gen2 SepCons. Correct? These are 300 um chips.
We received W648 from the production team this week. Upon inspection of this wafer, is has a higher density of pinholes than we have been seeing lately (>3 pinholes/slit compared to 0 or 1/slit) and seems to show a return of contamination, shown below. This contamination is visible over the entire wafer, but is easiest…
For this experiment, I looked into the stability of RTP treatment. Specifically, I tested discoloration rates for chips at different time points after I did RTP. The idea was to see if the beneficial effects of RTP depended on the time that chips were stored after RTP processing. Here’s the data: All chips were from…
My last cell post involved pictures of HUVECs after 1 day of growth on commercial transwells and pnc-Si Sepcons. Over the past week, I’ve been growing HUVEC on commercial PC transwells and pnc-Si in the Sepcon format in order to track the TEER. To get more data out of these cells, I decided to do…
On Friday I posted results from a diffusion experiment in which I tested “treated” and “untreated” SC256 samples against the diffusion of a mixture of DDM and BSA. The DDM-BSA solution contained an initial DDM concentration of 1.0% and an initial BSA concentration of 2.5mg/mL; the solution also contained 20mM HEPES and was at a…
This post is an update of the TAT ELISA study. Details of which can be found in the prior post by Keisha and I: https://trace-bmps.org/blog/data/2016/02/18/hemocompatibility-studies This is the most up-to-date data: The error bar represents the standard error of mean. n = 3 for each group NOTE: We used serum as the positive control…. serum is…
Introduction Static endothelial cell cultures have been routinely performed and optimized on the µSiM platform for multiple membrane and cell types. In order to increase the physiological relevance of our device with tissue vasculature mimetics, we need to incorporate fluid flow to emulate shear stresses experienced by endothelium under physiological circulatory conditions. Recently Mehran has…
This could be a breakthrough for SepCon applied to biologicals and concentrated nanoparticles.
The role of the g-force in keeping the membrane clear of particles is interesting. We need to spin high enough pull the cake away. A little counter-intuitive, but spinning harder might be the key to prevent clogging.
Chris recently asked about the relative number of particles in solution and pores in the membrane.
I calculate a typical 5 slot sepcon has ~ 1 E8 million pores.
The solution with 20 nm NPs used above has 5 E13 NPs/mL.
At these concentrations, there are many more particles than pores.