TAT ELISA study for substrate hemocompatibility
This post is an update of the TAT ELISA study.
Details of which can be found in the prior post by Keisha and I: https://trace-bmps.org/blog/data/2016/02/18/hemocompatibility-studies
This is the most up-to-date data:
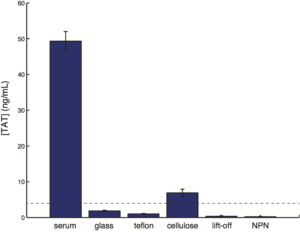
- The error bar represents the standard error of mean.
- n = 3 for each group
NOTE:
- We used serum as the positive control…. serum is essentially the supernatant obtained from unheparinized blood that is allowed to clot. To describe briefly, blood is let to clot for 30 minutes, then centrifuging at 2000 rcf for 10 minutes to collect the serum (supernatant).
-
Since PDMS block is used to define the surface area to volume ratio of the system, we also included PDMS as an internal reference. [TAT] of the PDMS x the surface area of the wall/total surface area is calculated as the background correction, and is subtracted from the [TAT] measured for all samples.
-
The dashed line represent the 4 ng/mL level. Normal level of TAT in plasma should be less than 4 ng/mL.
Source:
http://www.rbclab.com/Pages/200/250/250.4/36%20TAT/250.4.36.html
http://www.questdiagnostics.com/testcenter/TestDetail.action?ntc=10162
Post Hoc hypothesis test (Fisher’s LSD)
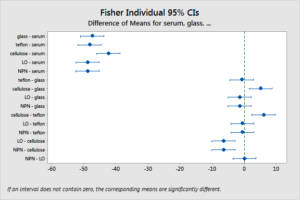
Essentially, differences were seen between serum control and all other substrate types. Differences were also seen between cellulose and all other substrate types. No differences were seen for all other pairwise comparisons.