C3a ELISA study for substrate hemocompatibility
Purpose: Study the hemocompatibility of different substrates using the concentration of C3a as the indicator.
Background: C3a is a protein produced during immune response. Directly from Wikipedia: The classical pathway of complement activation is initiated when the C1 complex, made up of C1r and C1s serine proteases, recognizes the Fc region of IgM or IgG antibodies [1]. The lectin pathway is activated when pattern-recognition receptors, like mannan-binding lectin or ficolins, recognize and bind to pathogen-associated molecular patterns on the antigen, including sugars [2].
Blood incubation on substrates
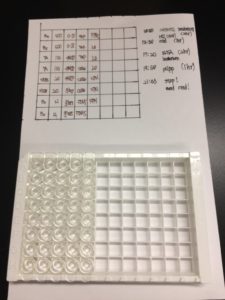
We defined a specific substrate area to be tested by placing a hole-punched PDMS block on top of the substrate. The punched holes are each 10mm in diameter. See below:

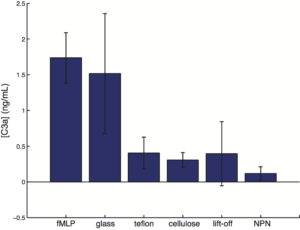
the substrates are: glass with 10 nM fMLP (n = 3), glass(n = 3), teflon (n = 3), cellulose membrane (n = 3), PDMS(n = 3), lift-off membrane (n = 3), nanoporous nitride membrane (n = 3). NOTE: The 10 nM fMLP in theory serve as a positive control as fMLP should be recognized by the pattern-recognition receptors to initiate the Lectin Pathway. The cellulose sample is actually a circular sheet of cellulose (9 mm diameter) that was placed on top of teflon in the well. Teflon was chosen as the hosting background, under the assumption that teflon minimally activate the immune response/C3a production. PDMS is also chosen as a testing substrate to assess if the PDMS block itself also trigger C3a production.
250 μL of blood was placed in each well. All samples are kept in petridish and placed in an incubator (37°C; 5% CO2; 80% humidity) for 2 hr. Kimwipes that were prewetted with DiH2O were placed in each petridish to help reduce sample evaporation. NOTE : To avoid possible low-level complement activation, the blood were drawn into a ETDA tube (lavender topped) instead of heparin tube (green topped) in accordance to the ELISA kit recommendation.
Sample processing (plasma extraction and precipitation)
It is necessary to precipitate out proteins in the sample since proteins compete with complements in the ELISA assay.
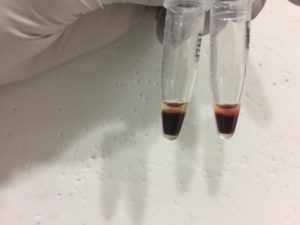
After the 2 hr incubation, the samples were collected into 1.5 mL microfuge tube and spun at 2000 rcf for 15 min to collected cell-free plasma (the yellow portion on top). Whole proteins were then precipitated from the plasma via the following: Cell-free plasma (70 μL) was combined with of the complement reagent A (70 μL) and vortexed thoroughly to mix. 10N HCL (15.5 μL) was then added to the mixture and vortexed thoroughly to mix and let sit for 1 hr. The mixture were then spun at 10,000 RPM at the standard benchtop centrifuge for 5 min. 55 μL of the supernatant was then combined with 9N NaOH (6 μL) and vortexed thoroughly to mix. Complement reagent B (187 μL) was added the mixture and vortexed thoroughly to mix. 3.33 μL of Assay Buffer was then added to the mixture to bring the sample to a 1:10 dilution. The sample was then further diluted 1:50 in Assay Buffer. The 1:500 diluted samples should be within the detection range of the ELISA kit.
NOTE: Interestingly, for both time that I ran the the C3a ELISA experiment there always seems to be red blood cell lysis for the cellulose sample (the right sample below). Tejas said he observed the same thing when he ran his ELISA assay.
NOTE: these are samples with 70 μL of the supernatant removed.
The ELISA assay
The ELISA is ran in accordance to manufacturer protocol: ab133037-complement-c3a-des-arg-human-elisa-kit-v4-website
Result
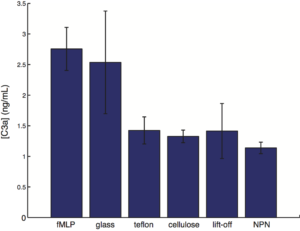
- The error bar represents the standard error of mean.
- n = 3 for each group
raw data: with PDMS
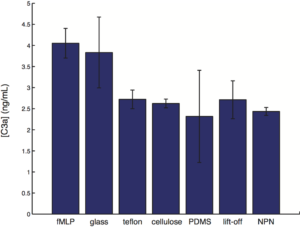
full subtraction of PDMS from all:
NOTE:
- Since PDMS block is used to define the surface area to volume ratio of the system, we also included PDMS as an internal reference. [C3a] of the PDMS x the surface area of the wall/total surface area is calculated as the background correction, and is subtracted from the [C3a] measured for all samples.
-
The first time that I ran the C3a ELISA I ran a 1:10 diluted sample against standards that range from 1000 ng/mL to 0.1 ng/mL. The [C3a] measured for the different samples are all around the 1000 ng/mL range which is almost outside the range of the standards. I ran the C3a ELISA for a 2nd time with the 1:500 diluted sample against standards that range from 500 ng/mL to 0.4 ng/mL. It is comforting to see that I hit the predicted order of magnitude on the 2nd try (1:500 of 1000 ng/mL is ~2 ng/mL, similar to the average of 2.5 ng/mL observed here). This somewhat suggest repeatability. Interestingly, cellulose, which seem to trigger red blood cell lysis, did not produce high level of C3a as saw in the paper by the Roy group (https://trace-bmps.org/wp-content/uploads/2016/10/muthusubramaniam-roy-annal-of-biomedical-engineering-2011.pdf).
References
- Arlaud, G. J., Gaboriaud, C., Thielens, N. M., Rossi, V., Bersch, B., Hernandez, J. F., & Fontecilla‐Camps, J. C. (2001). Structural biology of C1: dissection of a complex molecular machinery. Immunological reviews, 180(1), 136-145.
- Dunkelberger, J. R., & Song, W. C. (2010). Complement and its role in innate and adaptive immune responses. Cell research, 20(1), 34-50.
Post Hoc hypothesis test (Fisher’s LSD)

Except for glass, all other substrate types were different from the fMLP control. No differences were seen for all other pairwise comparisons, other than the comparison between NPN and glass.
Well done Henry. I see the Gaborski group is improving your blog organization. With the TAT study you showed an absolute level which is considered ‘low’ by some standard. NPN fell below this level. Is there a similar standard for C3a? By the way, you might want to include the TAT study here because I don’t believe it has been published on the blog.
Also – honestly there must be a better positive control
Definitely worth looking into. One paper reported a C3a level of 14 nM in plasma as an indicator of high sepsis mortality [1]. The clinical reference range expected from a healthy person is ~ 0 – 780 ng/mL [2,3].
The 1:500 diluted sample has a C3a level of ~2.5 ng/mL. So the original sample has a C3a level of 500*2.5 ng/mL = 1250 ng/mL, outside the clinical reference range. This suggest that the bloods are quite activated on these substrates, and thus possibly explain why the fMLP control doesn’t produce [C3a] that are higher than all other samples.
This interpretation is however somewhat flawed…. because in reality the surface area (device) to volume (total blood in patient) ratio is quite different (much lower) than the one seen in this experiment.
PS 1: Mass of C3a is about 10kDa according to Wikipedia. So 2.5 ng/mL is ~0.25 nM. 500*0.3 nM = 125 nM.
PS 2: From past experience, I noticed that neutrophils in general are quite activated at 37°C and so that neutrophils with or without immune stimulant all look quite the same (all assume the activated, omletty morphology). At room temperature though morphological differences are observed (neutrophils without stimulant retained the resting, spherical morphology, while the ones with stimulant went omletty.) Perhaps the C3a level of all samples (except the positive control of 10 nM fMLP) would all be lowered should this experiment be conducted at room temperature.
source: https://www.ncbi.nlm.nih.gov/pubmed/2783358
1. Hack, C. E., Nuijens, J. H., Felt-Bersma, R. J., Schreuder, W. O., Eerenberg-Belmer, A. J., Paardekooper, J., … & Thijs, L. G. (1989). Elevated plasma levels of the anaphylatoxins C3a and C4a are associated with a fatal outcome in sepsis. The American journal of medicine, 86(1), 20-26.
2. C3a reference range according to Mayo Clinic: http://www.mayomedicallaboratories.com/test-catalog/Clinical+and+Interpretive/90463
3. C3a reference range according to Quest Diagnostic: http://www.questdiagnostics.com/testcenter/TestDetail.action?ntc=17689
Yep. I think this experiment needs to be done at RT. Was the TAT study done at RT?
no, TAT was done at 37°C to help boost the signal. The TAT ELISA done at room temperature has a pretty low signal.
i followed Tom’s suggestion using the PDMS as background for subtraction. Since PDMS block was used to define the surface area to volume ratio of the system, we also included PDMS as an internal reference for the [C3a] measurement. [C3a] of the PDMS x the surface area of the wall/total surface area is calculated as a background correction factor, and is subtracted from the [C3a] measured for all samples. I did the same for the TAT ELISA as well (link to the TAT ELISA data here: https://trace-bmps.org/blog/data/2016/10/23/tat-elisa-study-for-substrate-hemocompatibility)
Why not just subtract the PDMS value? I don’t understand [C3a] x surface area.
For all substrate the walls are made of PDMS. For the PDMS sample the wall and the “floor” are all PDMS. So assuming the [C3a] produced is proportional to the surface area of the system, the contribution of [C3a] from the wall would be [C3a] pf PDMS x wall area/total surface area.
Alternatively one could just say we are subtracting the signal of a known biocompatible material = silicone. Assuming that silicone is inert and that 100% of the signal comes from systemic activation of blood during its isolation.
Can you generate a 3rd plot with the average PDMS signal subtracted from all of the samples.
3rd plot updated.
Thanks Henry – The graph looks great now and the logic works in the following way.
Silicone is a known biocompatible material. So we will assume that all signal in excess of the silicone signal is generated by the presence of the non-silicone material.
By this reasoning the part of the NPN contribution that looks just like the PDMS contribution from the floor of the device should be subtracted too.
This is post-hoc reasoning for sure but I think it is a sensible way to interpret an imperfect experiment. The real biocompatibility/hemocompatibility will have to be done with the full device in operation with whole blood and probably with a living system.
Agreed. The dialysis trials with living subjects will be the true testament of system performance.