Absorption of Carbon Dioxide into Cell Media Using Nanomembrane Technology-Updated!
It is of interest to investigate the properties of CO2 transfer into a cell culture media using nanomembrane technologies. Maintaining the pH of the cell culture medium is critical to cell viability. Most cell lines grow well at pH 7.4 and are inhibited by growth at pH 6.8. Glucose is usually the sugar included in media and is metabolized by the cells very rapidly, at a rate faster than it is needed. Byproducts of this metabolism include pyruvic, lactic acids, and CO2 . To reduce the amount of lactic acid, glucose can be replaced with other sugars such as galactose or fructose. These sugars are utilized at a slower rate, but also result in a slower rate of cell growth. This replacement can slow down the onset of a pH shift. The bicarbonate and carbon dioxide buffering system is most commonly used to maintain physiological pH 7.2-7.4 of a culture. Bicarbonate is a weak buffer with a pKa of 6.1 making a pH range of 7.2-7.6 more difficult to prevent rapid pH changes. Bicarbonate, however, is non-toxic, and has nutritional value.
Why is pH important?

CO2 tension
The cell culture demands a certain concentration of CO2 and bicarbonate for pH. Since bicarbonate and carbonic acid are in a rapid equilibrium relationships with water and CO2 it is impossible to maintain adequate concentration of carbonic acid and bicarbonate in the media without also maintaining an increased partial pressure of carbon dioxide in the gaseous phase. For monolayer cultures, this can be accomplished by limiting diffusion of metabolic carbon dioxide out of the culture vessel. Although there is danger of over-acidification due to excess accumulation of carbon dioxide.
Buffering
The need for CO2 creates problems for pH control. A bicarbonate
HOW DOES CELL CULTURE BUFFERING WORK?
The amount of dissolved CO2 in water is dependent on the amount of atmospheric CO2 and the temperature. Increasing CO2 tension in the absence of sodium bicarbonate leaves the medium acidic. The addition of sodium bicarbonate in the presence of CO2 will drive the equation above to the left to allow for an equilibrium to be acheived and the pH maintained at 7.2-7.4.
NaHCO3 + H2 O ↔ Na+ + HCO3 – + H2 O ↔ Na+ + H2 CO3 + OH- ↔ Na+ + H2 O +OH- + [CO2 (aq) ↔ CO2 (g)]
Sodium bicarbonate is a buffer used to stabilize pH. CO2 affects the pH of medium. Increasing atmospheric CO2 decreases the pH of the medium. Decreasing the atmospheric CO2 increases the pH of the medium. Where H2CO3 is carbonic acid. And HCO3- is bicarbonate. CO2 dissolves freely into the culture media and reacts with water to form carbonic acid. Cells also produce CO2 which increases the acidity along with the production of lactic acid. In culture media, dissolved CO2 is in equilibrium with bicarbonate ions and many cell culture media formulations take advantage of this CO2/bicarbonate reaction to buffer the pH of the media. Sodium bicarbonate, NaHCO3, is used as a buffer. Sodium bicarbonate dissociates into sodium and bicarbonate ions. The concentration of the sodium bicarbonate in the medium must be matched with the level of CO2 in the atmosphere above the medium. Which is shown below by this graph.

If the medium contains phenol red, the color of the medium becomes more yellow. Eventually the media will need to be replaced when the buffering system has run out of bicarbonate.
ALSO:
Although CO2 is produced by growing cells, it is not produced in a high enough level when growing at a low cell density or during lag phase to maintain an optimal pH. Use of a CO2 incubator helps to control the CO2 tension and the temperature.
NANOMEMBRANES FOR CARBON DIOXIDE-BICARBONATE BUFFERING
Theory.
Using a simple device design, we propose to introduce CO2 into cell media by flowing co2 over the membrane into liquid media that is flowing on the bottom of the device. The device design is given below.
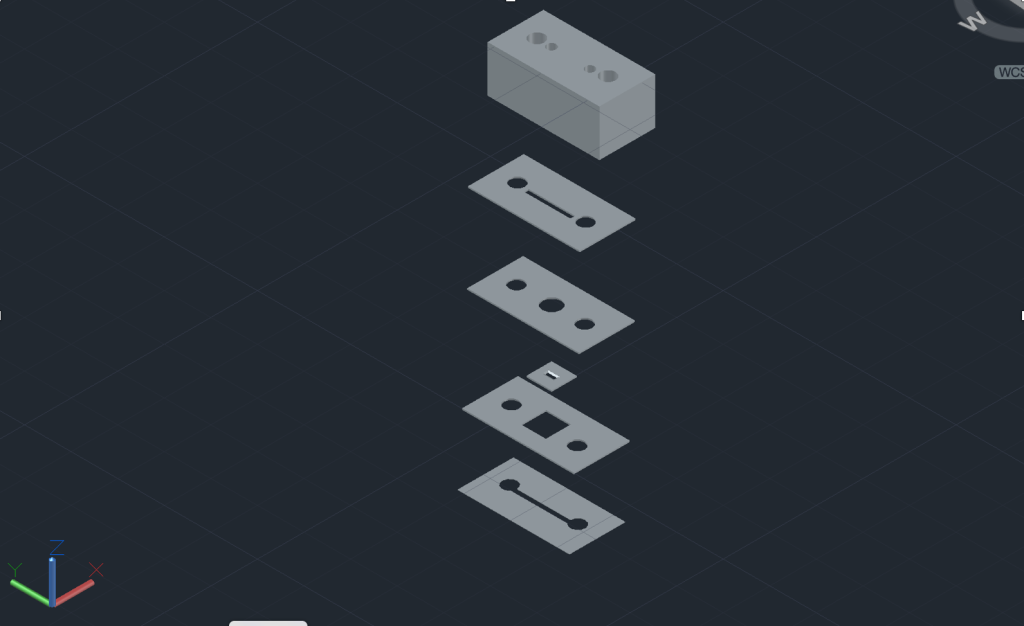
CO2 at a specific flowrate will be flowed on top of the membrane with media flowing on the bottom at a variable flow rate.
In order to measure the amount of CO2 in the system that is absorbed, a standard curve that relates pH and absorbance (phenol red) was created.
By adding known amounts of Acid and Base into media and measuring the pH a standard curve was made that correlates the pH of the system and the color change in phenol red.

The working range of phenol red is 560nm. And the curve is given below.
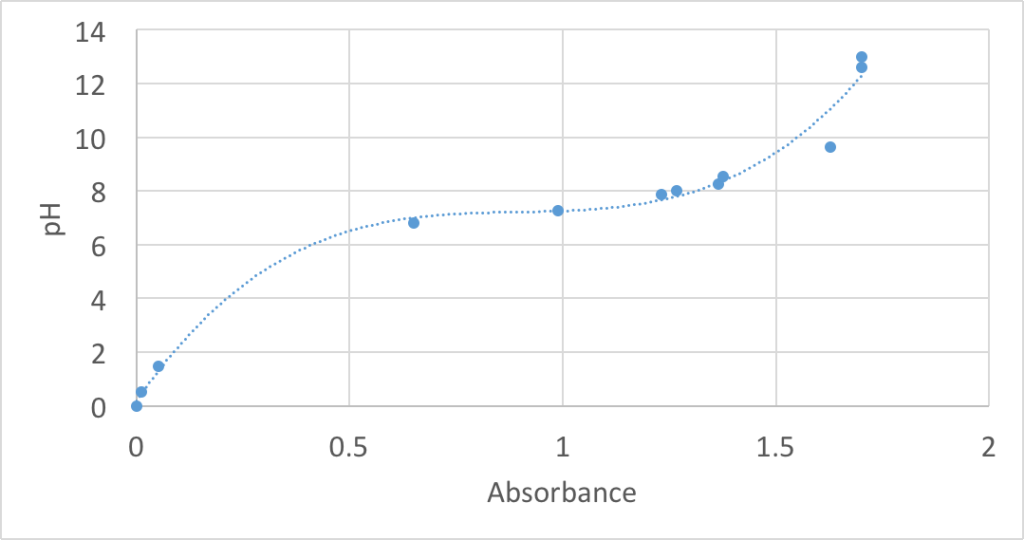
Using this chart the pH can be calculated based on the color change and base added.
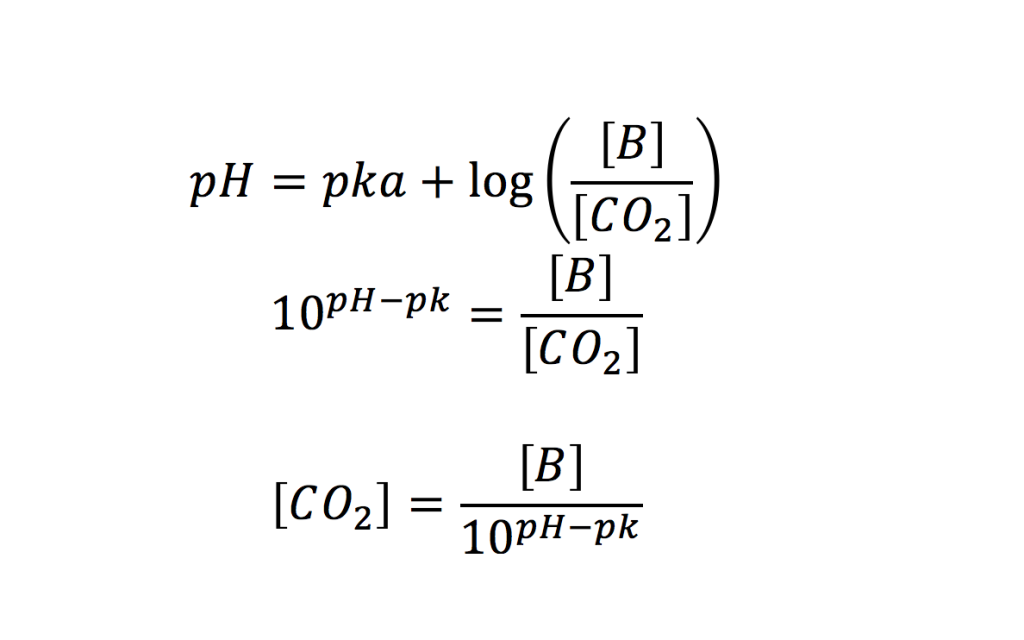
The concentration of CO2 is given by Henderson hasselbach reactions equations given below. Where the pk is given as 6.1 for this reaction. The bicarbonate molarite for DMEM is 0.04
EXPERIMENTS
The devices were assembled and set up according to the picture below with insertion of 100% co2 gas at a pressure of 0.116psi. Media was perfused on the bottom of the chamber on closest to the “flat” side of the membrane.
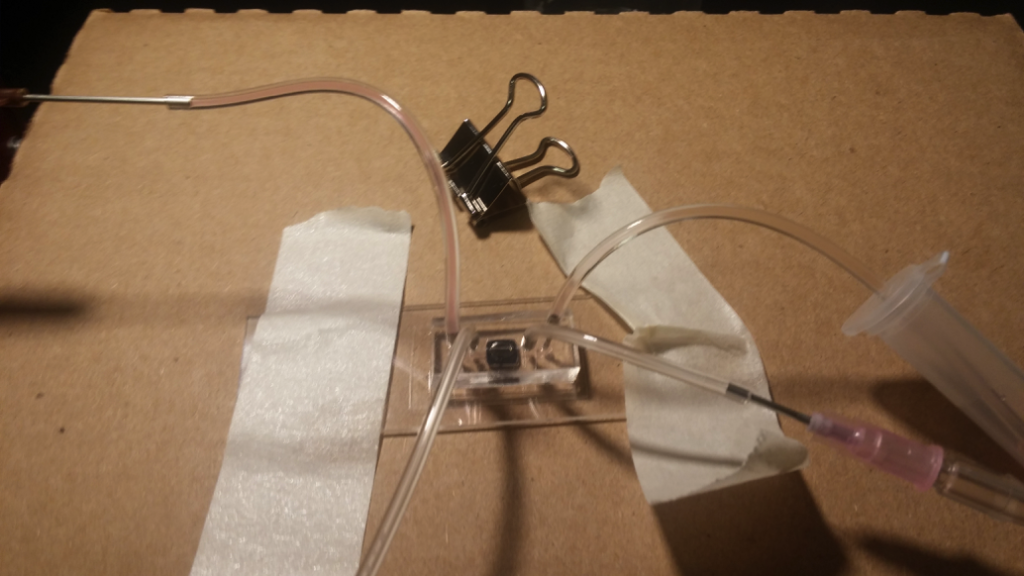
Media was perfused at variable flow rates and collected on the right at volumes of 100microliters. The gas pressure flow rate was kept constant.
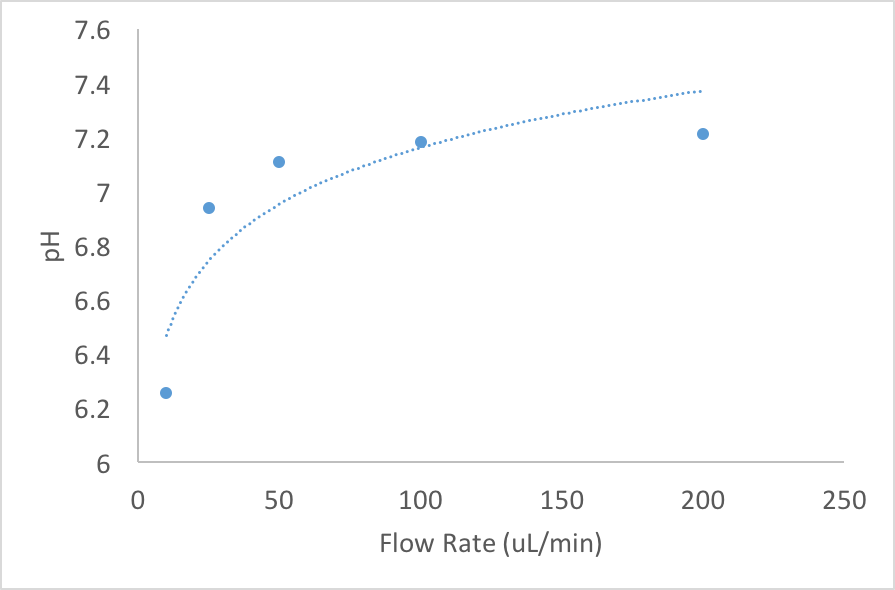
The absorbance of the 100 microliter samples was measured using a photospectrometer. Then the pH was calculated and plotted as a function of flow rate.
The results of the experiment are given below.
DISCUSSION
We can calculate the amount of CO2 that was absorbed into the system based on the pH for different flow rates.

For the syringe pump system the media is only exposed to the CO2 at the membrane interface for a certain amount of time to allow CO2 into the system.. Depending on the flow rate of the media and the volume space of the system, the TIME that the media is exposed to CO2 can be calculated.
Assuming that the CO2 is absorbed into a fix volume of (0.154mm^3) and that the reaction time of the fluid can be calculated the amount of time that the
So subsequently
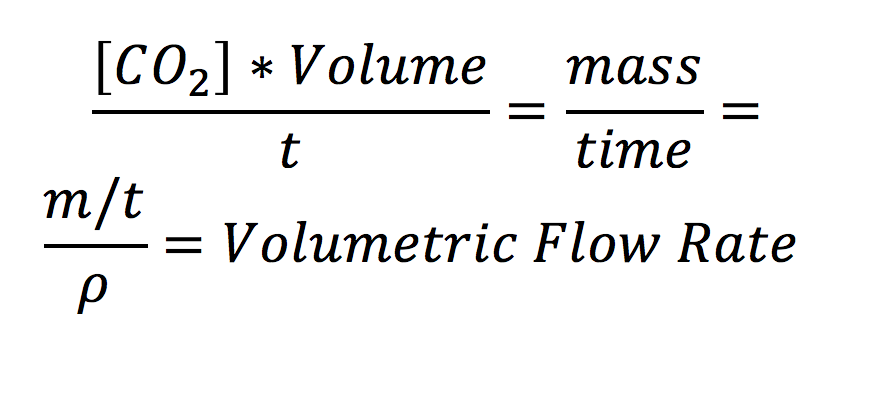

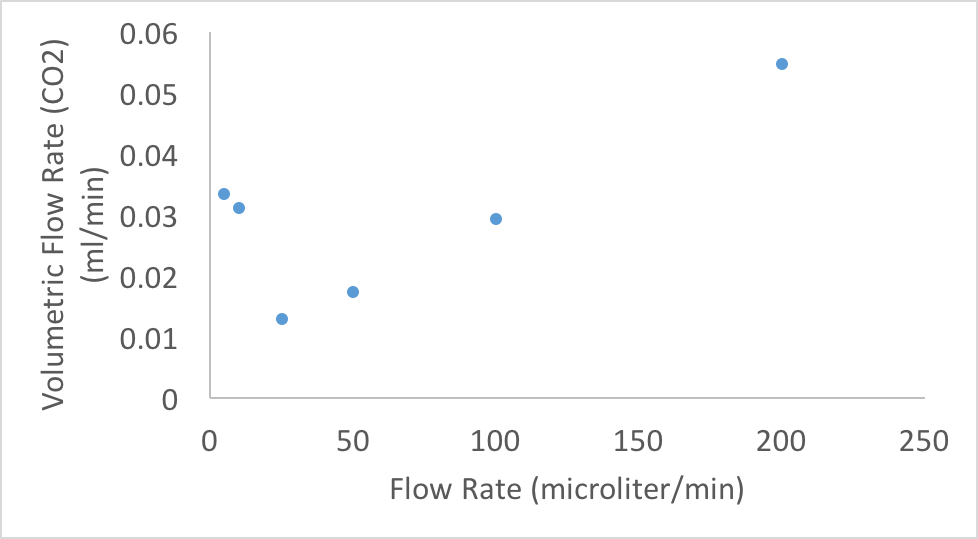
In review, with a given absorbance value, the pH can be calculated from which the concentration of carbon dioxide can be calculated and a volumetric flow rate can be computed.
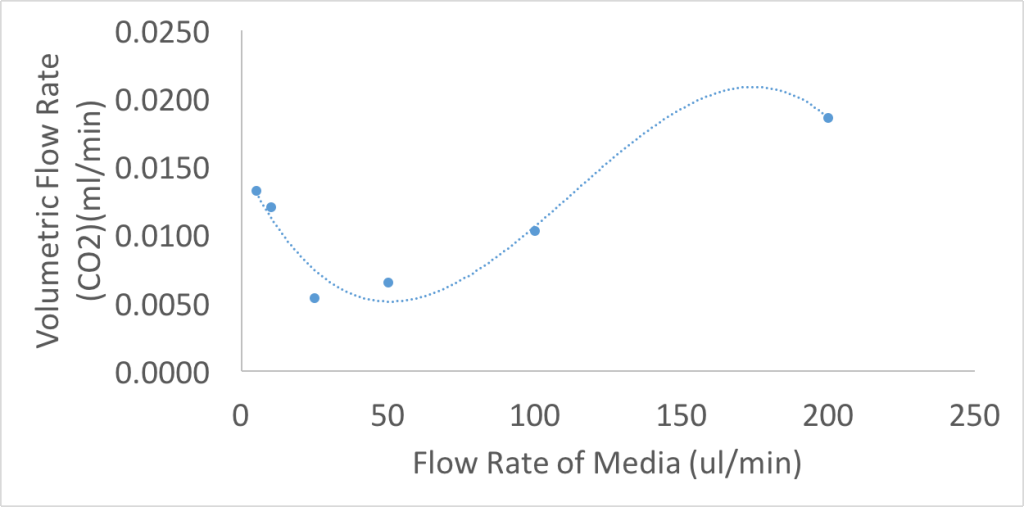
The results of the volumetric flow rate (gas into system) as a function of flow rate of media is given below.
The CO2 trasnfer is very comparable to literature but because the membrane area is so small the flux ends up being very small.
If we divide by the membrane area which is 0.14mm^2 you can calculate a Volumetric Flux
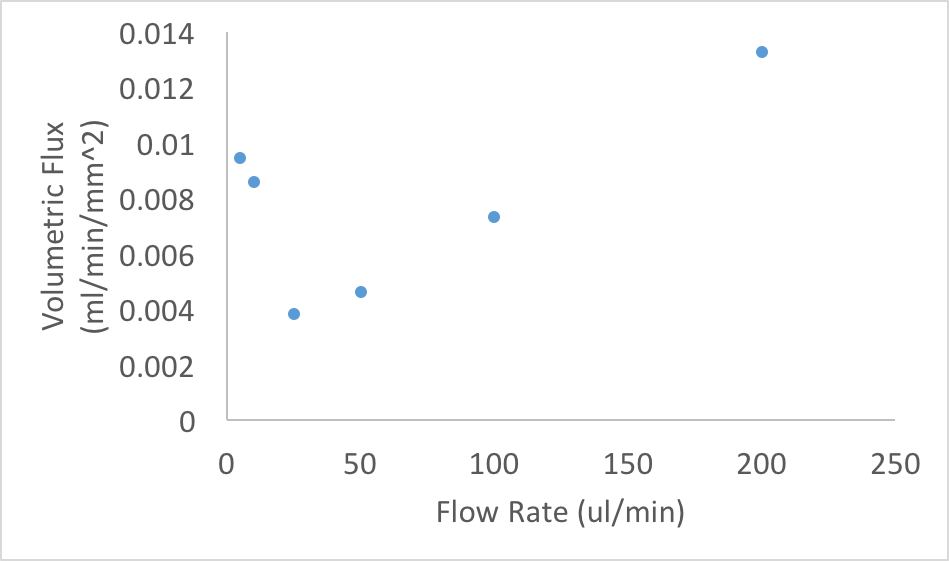
There seems to be a interplay between how fast the media is flowing and how slow the media is traveling.
The values at the lower end of the chart might seem to give similar flux as the fast flow rate but this is not true. Even though the media is being exposed to CO2 for longer times at the slower flow rates, because it takes so long for the media to collect at the end of the run some of the CO2 that was in the media is actually released into the atmosphere. So the reading makes it seem that the values are not as real and that the media was exposed for less time.
The results given above are for 100% CO2. Most cell cultures are run at 5% CO2 which will be the next set of experiments. The system will also be closed and run with a peristaltic pump.
Some random thoughts.
If we take 5% of the values for volumetric flow rates given above and plot them as a function of flow rate we get the chart below. Which we could theoretically use to back calculate the flow rates we need to achieve our desired pH values…
If we compare the values to the literature …
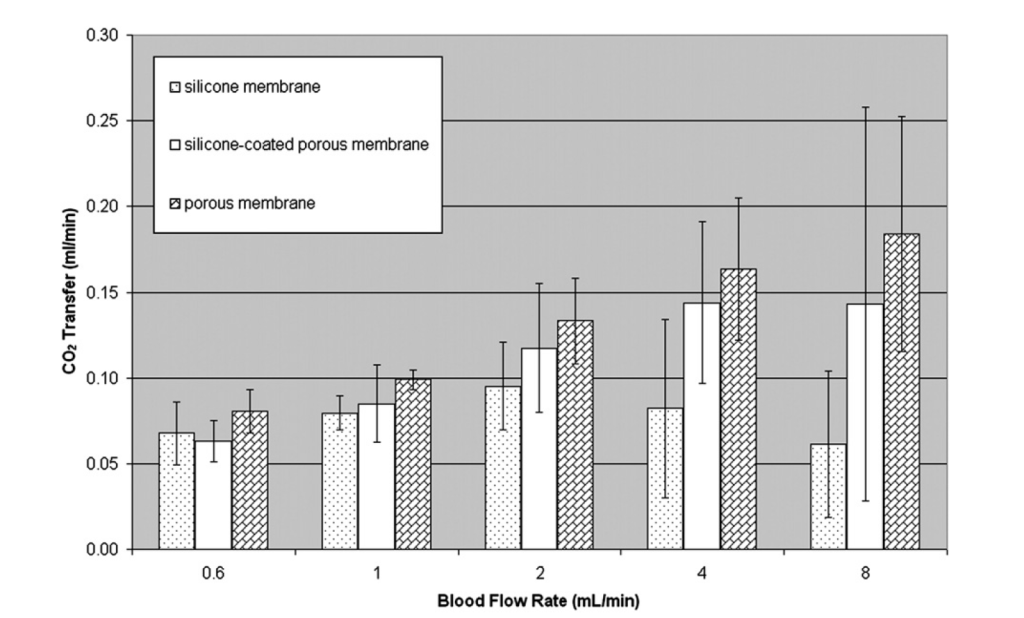
Where pore size =100 micron
By using the entire area of the vascular network, the oxygen and carbon dioxide gas exchange was 89.3 and 78.1 mL/min/m2 ,respectively, at 4 mL/min blood flow in the device. Thesevalues for oxygen and carbon dioxide exchange are similarto hollow fiber-based oxygenators, including the Biolung16(oxygen transfer rate 64 mL/min/m2 ) and the Ambulatory-AVCO2R prototype. However the pressure they use is 1atm and we use 0.116atm.
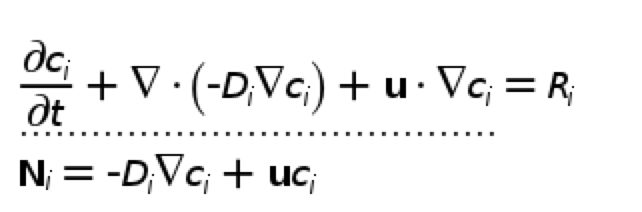
Some modeling considerations…
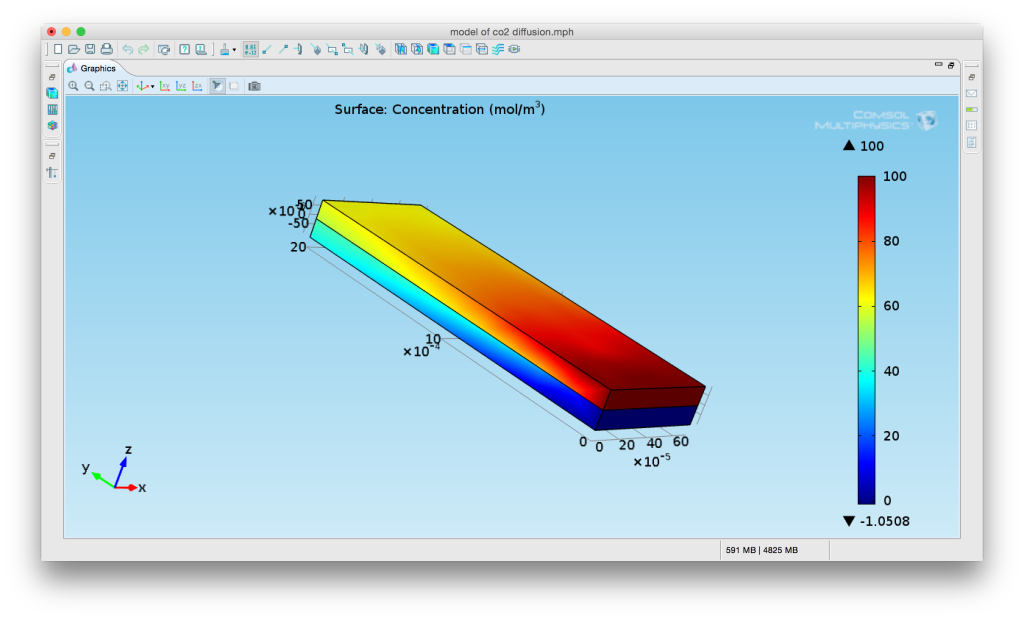
Equations of interest…