Endothelial cell attachment to porous substrates via focal adhesions is initially affected by pore spacing and not absolute porosity. Maturation of endothelial monolayers via cell-cell interactions occurred over the same time course regardless of substrate porosity, pore size and contact area. Cell-matrix interactions at maturity were dictated by substrate stiffness.
Data
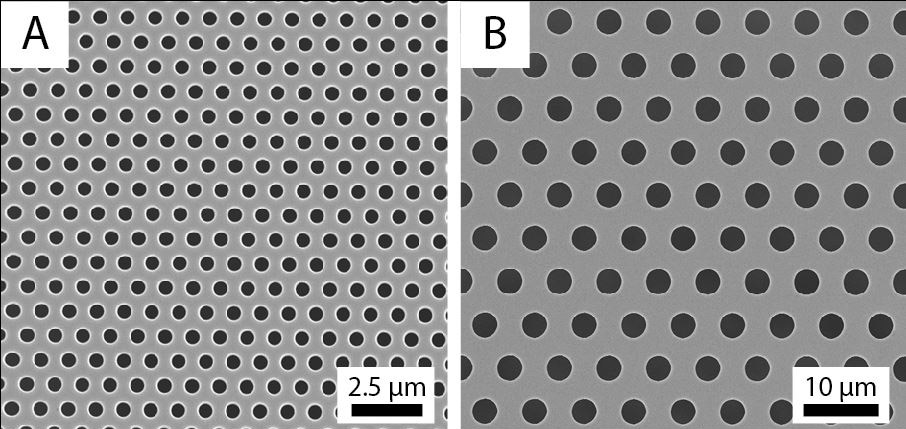
Fig. 1 SEM images of 0.5 mm and 3.0 mm pore size membranes. Spacing between pores is one pore diameter. Porosity for both membranes is 22.7%.
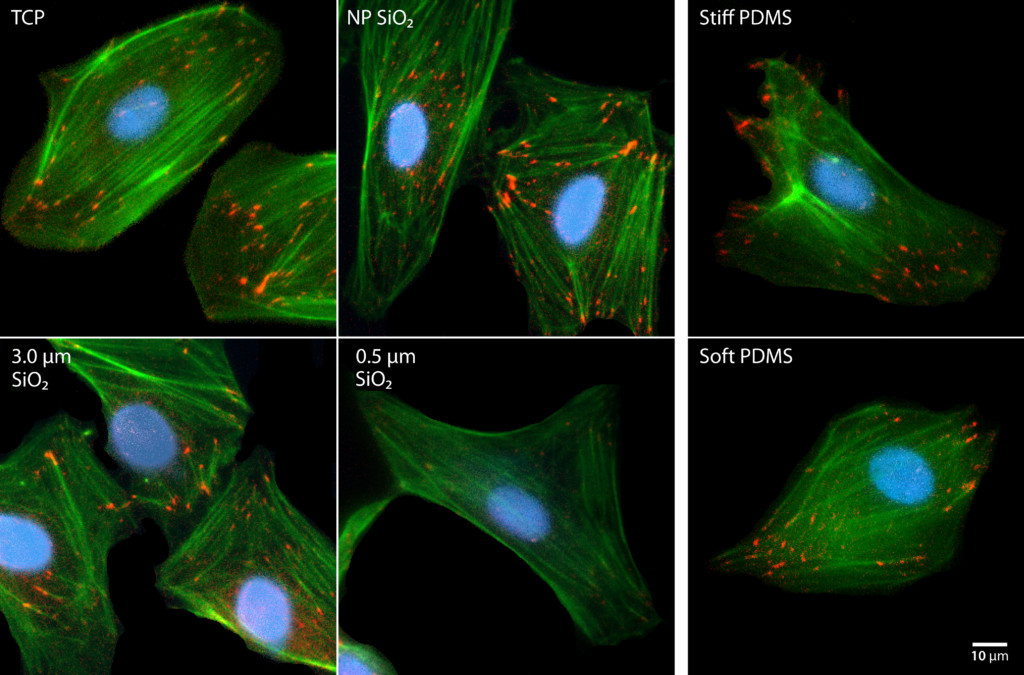
Fig. 2 Cell attachment to substrates through focal adhesions at 24 hours. HUVEC were cultured on tissue culture plastic (TCP), non-porous, 3.0 µm high porosity, 0.5 µm high porosity SiO2 membranes, and stiff (E = 2 MPa), and soft PDMS (E = 5kPa). Cells were stained with DAPI (nuclei, blue), phalloidin (actin filaments, green), and anti-vinculin (focal adhesion vinculin, red).
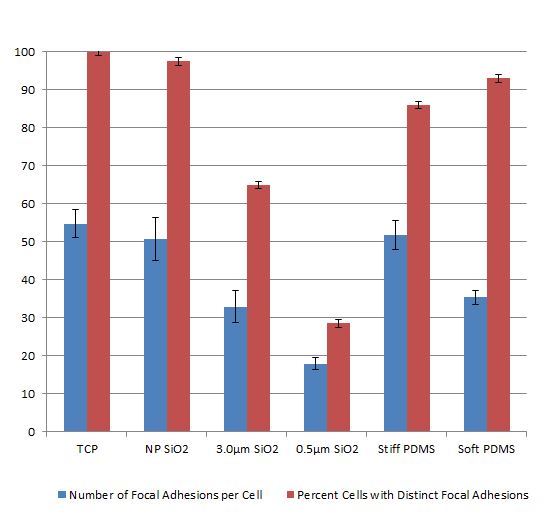
Fig. 3 Quantification of focal adhesion formation. Formation of distinct focal adhesions was quantified for all substrates – number of focal adhesions per cell and percent of cells with distinct focal adhesions. Error bars are +/- SD. Sample size >50 for each substrate.
[missing figure]
Fig. 4 Endothelial Barrier Maturity. HUVEC were cultured to form a monolayer on tissue culture plastic (TCP), non-porous, 3.0 µm high porosity, 0.5 µm high porosity SiO2 membranes, and stiff (E = 2 MPa), and soft PDMS (E = 5kPa). Cells were stained with DAPI (nuclei, blue), anti-VE-cadherin (cell-cell junctions, green), and anti-vinculin (focal adhesions, red) to visualize formation of endothelial barriers.
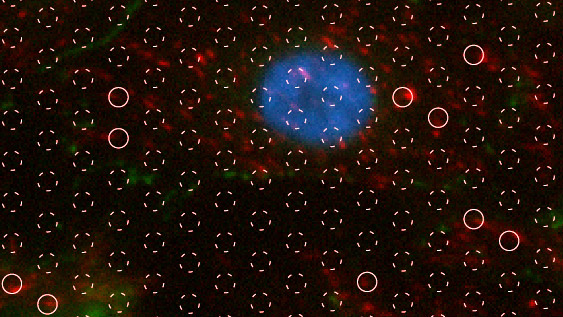
Fig. 5 High-resolution fluorescence image of focal adhesion formation on 3.0 µm pore size SiO2 membranes upon reaching confluence. White circles are locations of pores. Solid circles are locations where focal adhesions (vinculin, red) are present over the pore or at the pore edge.
Supplemental Data
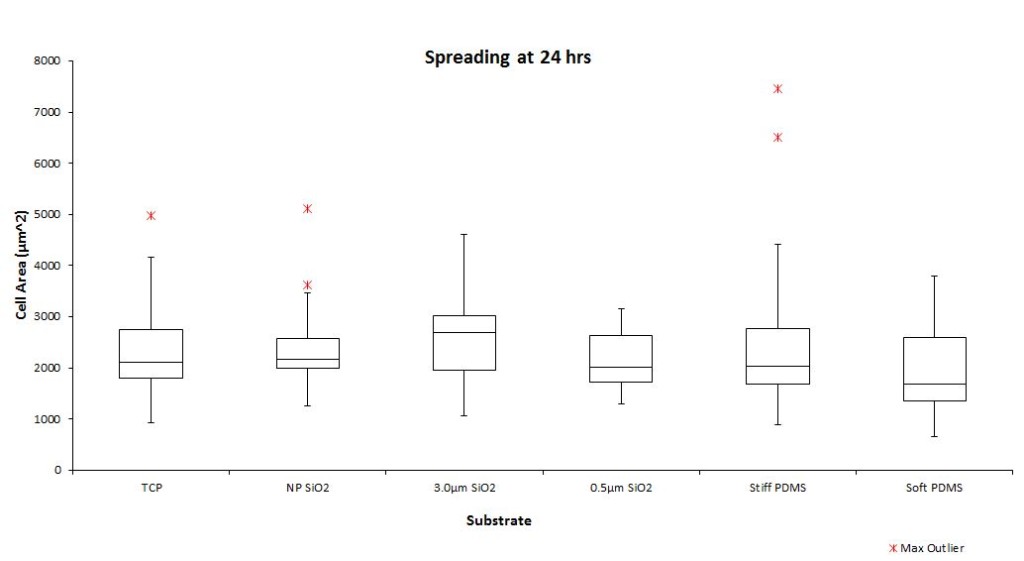
Fig. S1 Cell Spread Area at 24 hrs. HUVEC spread area was quantified 24 hrs post-seeding on TCP, non-porous SiO2 membranes, 3.0 µm pore size SiO2, 0.5 µm pore size SiO2, stiff PDMS (E = 2 MPa), and soft PDMS (E = 5kPa). The box plots represent median and IQR of spread area. Whiskers are +/- 1.5IQR.
I was not entirely satisfied with the amount of data that I received from my last burst pressure wafer, so I processed another wafer. This wafer had some yield loss initially, as well as window sizes that were slightly smaller than expected (by about 50 microns). We expect the mechanical strength of the windows to…
We ordered quantum dots from Invitrogen. These QDs have a PEG coating that terminates in COOH and should cause the dots to be negatively charged. They are about 12.6 nm in diameter: They exhibit a -40mV zeta potential by zetasizer measurements, however the particles appear to aggregate a great deal (under microscope and visibly turn…
This post is a brief update on the previous post of HUVEC migration on 0.5 μm porous substrates. Brief Recap We compared cell migration on nonporous (np), 0.5 μm low porosity, and 0.5 μm high porosity SiO2 membranes. Low and high porosity refer to a center-to-center distance of two or three pore diameters, respectively. For…
This is in continuation to the studies that I published here. I used two types of membrane surfaces: nano nitride trenches (the back side of membranes) with pure nitride on the surface, and zero-second-etch nano nitride with a completely intact pncSi cap on the top. These two surfaces basically act as materials with two extreme…
Purpose: The purpose of this investigation was to study the diffusion of Rhodamine, a florescent dye, in crosslinked Poly ethylene glycol (peg) using a Leica DMI 6000. Knowing the permeability of crosslinked peg is valuable as peg is a potential material for the hemodialysis project particularly the lift off component, and knowing about Rhodamine’s (MW…
Anticipating the eventual introduction of nanoporous SiO2 can we call non-porous SiO2 something other than np-SiO2?