The Completion of the First Stage of the Gauntlet (Knocking Aim 1 Out of the Park)
This post has been a long time coming, but I have finally (essentially) finished all the work for Aim 1 of my thesis. (Credit to Dan for helping with part of it and getting a thesis along the way, see his post here: https://trace-bmps.org/critical-flux-of-ultrathin-silicon-membranes-in-tangential-flow-filtration-of-protein-solutions/)
Up until this point, I have been attempting to validate my COMSOL model with experimental data on gold particle capture to dismal results. If anybody remembers (or you can see the post here: https://trace-bmps.org/experimental-validation-of-comsol-results/), I ran a ladder of capture experiments at 0%, 20%, 50%, 65%, and 85% ultrafiltration and counted the particles that were captured. I then plotted the data on the same curve as my COMSOL predicted results and had horrible agreement. Since then, I have been trying to confirm that data with repeat experiments. I suspected that there may have been leakage issues due to having an old device, so I took new PDMS top piece and re ran the experiment. I noticed however, that there was a problem with the PDMS that I was using and that was the pieces being highly angled. Therefore, when I clamped the device, the pressure was non-uniform and I had flow leaking backwards in addition to forwards. I remade the pieces and then re-ran the ladder again and found another major problem: aggregation.
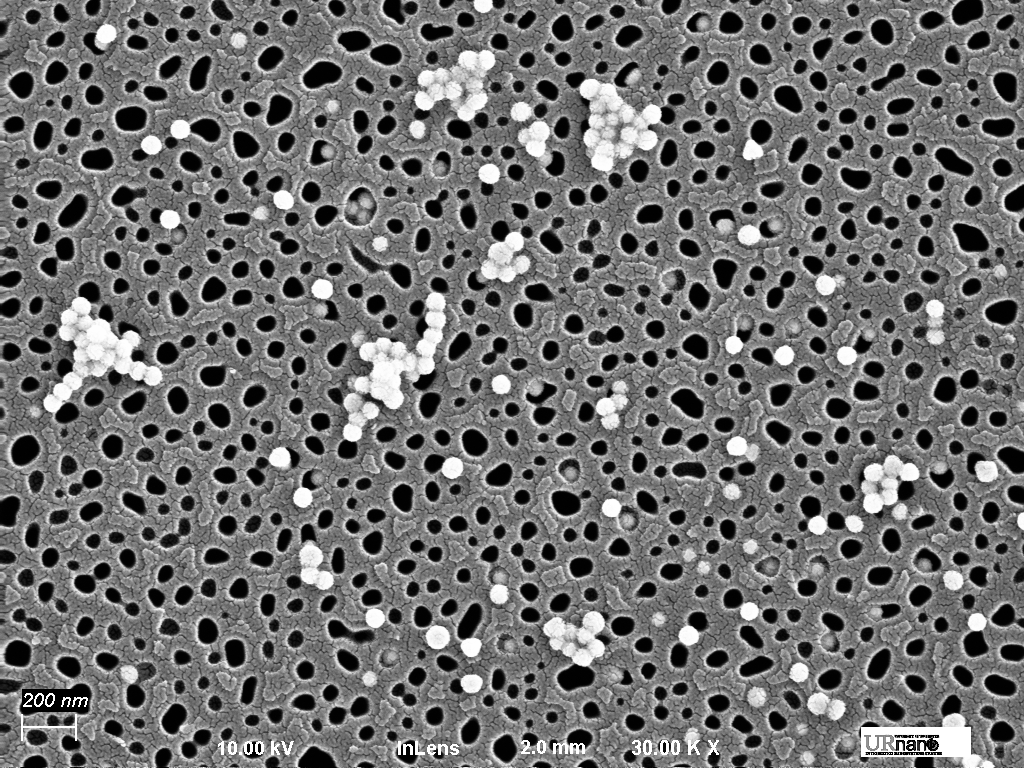
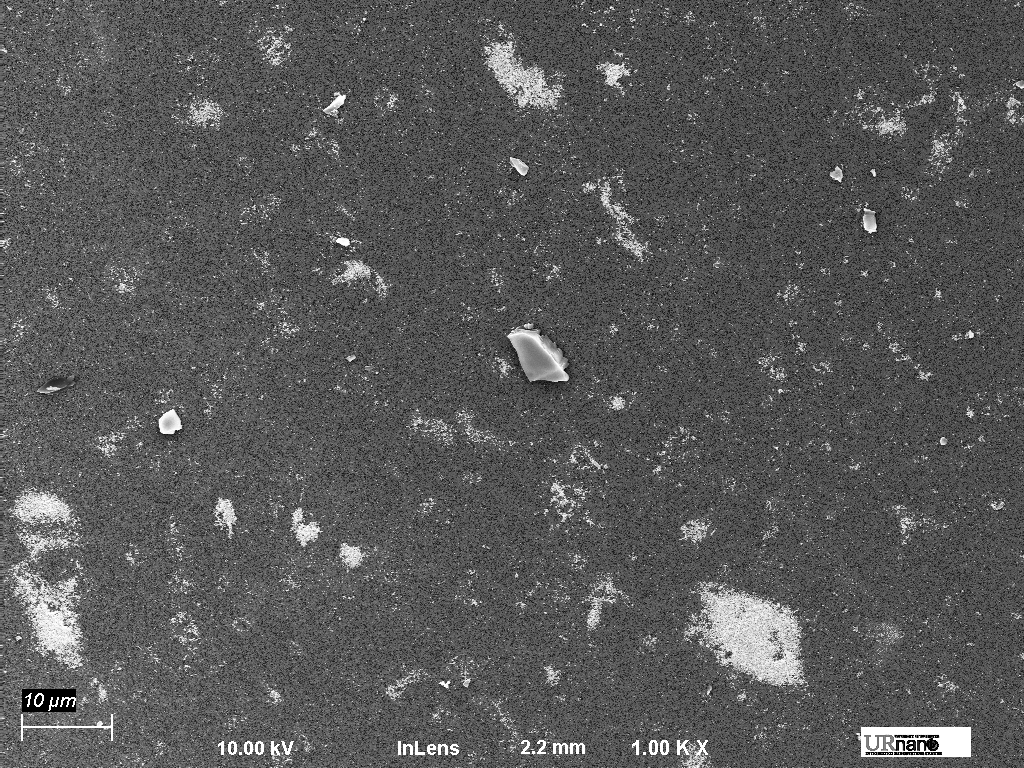
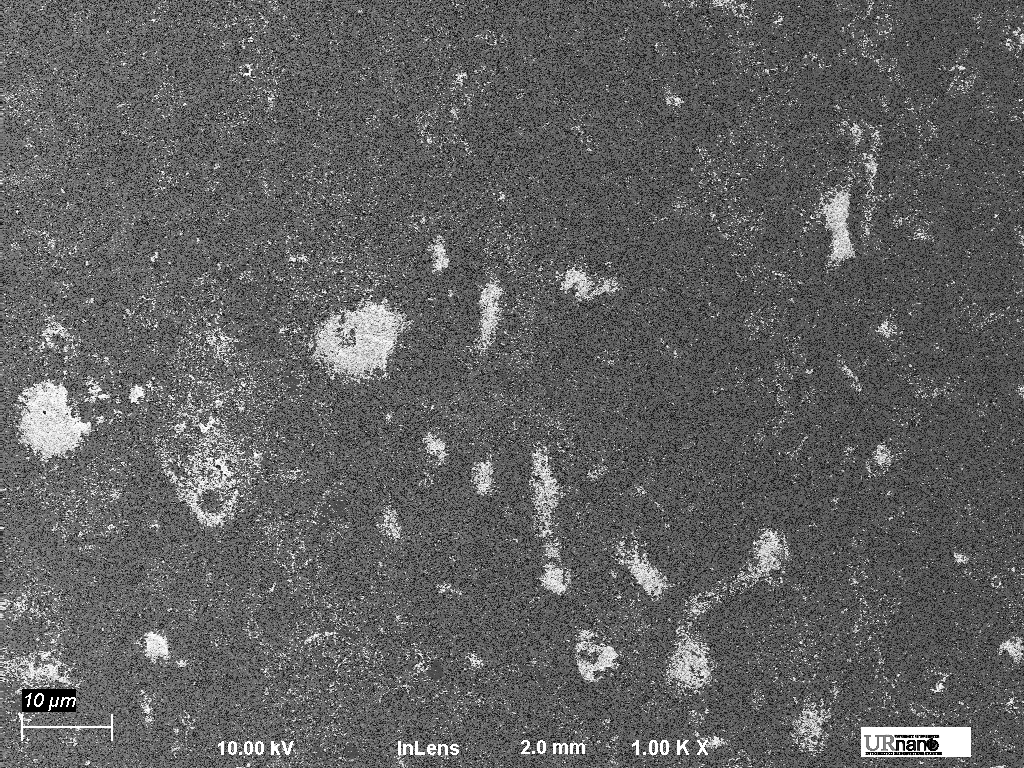
I suspected at first that the particles were aggregating in solution and that the gold was getting old (funky, fresh rhyme not intended), but upon doing NTA and DLS, found that this was not the case. The particles were both monodisperse and at high concentration. The results looked something like this:
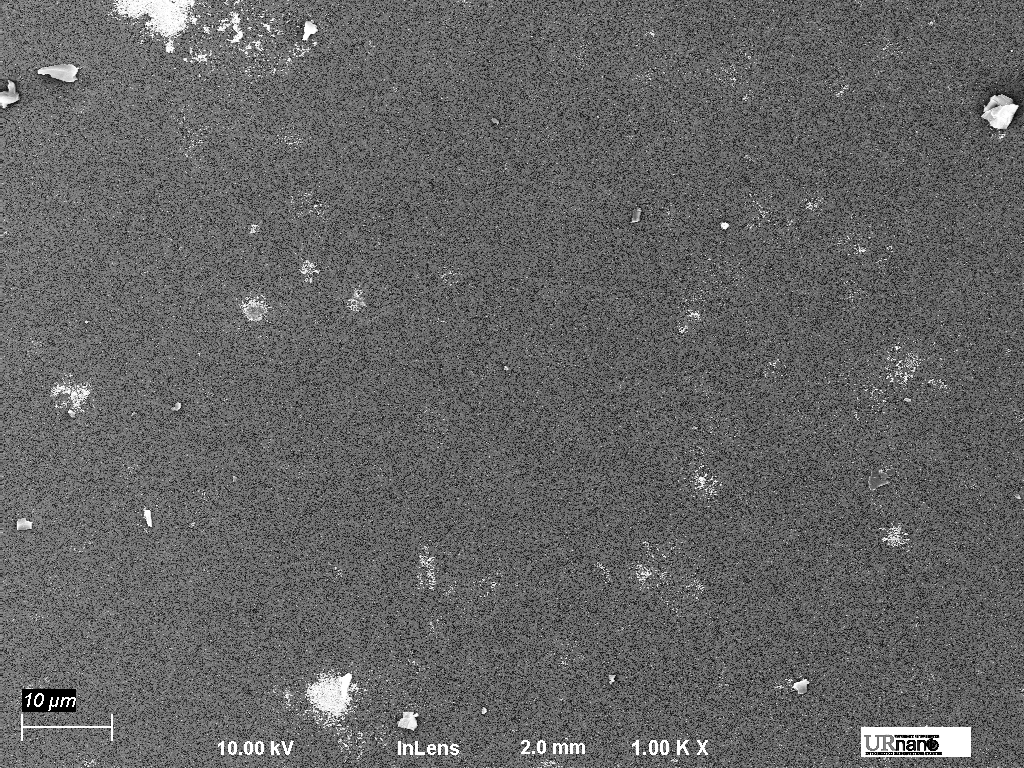
0% UF
65% UF
85% UF
As you can see, things look pretty horrible. There are gold aggregates all over the membrane and they are definitely increasing in both size and quantity as the ultrafiltration ratio increases.
This is bad. A simple three word statement that carries more weight than it seems. If the particles are aggregating as a result of concentration polarization, then how can we possibly get an objective sense of particle capture? Let’s step back for a second and explore this concentration polarization phenomenon a bit more closely…
Concentration polarization is the phenomenon of a perceived increase in concentration at some transport boundary. Traditionally, this concentration is thought of as some species that is crossing the boundary, but the rate at which the species passes through the boundary is much lower than the rate at which the species arrives at said boundary. Eventually, The species becomes concentrated at the boundary while waiting for molecules to pass across. In the case of particles, we would perceive this phenomena as a cake formation, as shown in the following figure:
Figure 1: Concentration Polarization and Aggregation in Tangential Flow Analyte Capture: Particles arrive in the system relatively disperse, but slower at the boundaries (A). As they experience the transmembrane flow, they are pulled towards the membrane (B), where they start to aggregate (C) because gold will stick to itself very easily. This leads to the formation of large aggregates on the surface (D), preventing particles from being pulled into and being captured by the pores.
Because gold is really good at sticking to itself, the particles in unprotected suspension will aggregate, which leads to the phenomenon that we observed in the electron micrographs. The aggregates, while likely containing similar numbers of particles, prevents particles from being in the pores, which is not good for the proposed mechanism of capture. Therefore, we had to come up with some mechanism that prevents the gold particles from aggregating and to do that, we used something that we were already working on for Dan’s stuff: BSA.
In my proposed Aim 1, I suggested that I would first complete these experiments without BSA to show the capture phenomenon and then do it again with BSA to prove that it still worked. However, it seems that the BSA could be necessary for capture (of gold at least) to work the way that I have proposed. So, setting out with this in mind, I used a low concentration of BSA (1 mg/mL) as my suspension solution and ran my experiment as a one-off at 85% ultrafiltration. And lo and behold:
no aggregates.
I tried to contain myself: this could be the breakthrough that I was looking for. This could lead to the completion of Aim 1, my model and experiments could potentially show some sort of relationship. I could be free of this torment!
But, I knew that the appropriate thing to do was to run all of my conditions in triplicate, to show that this was indeed a consistent, repeatable result across all ranges. So I prepared a stock of 1 mg/mL BSA and 15 new devices and re-ran all of my experiments. And sure enough, they worked!
0% UF
65%UF
85% UF
With the aggregation problem solved, I proceeded to count the particles in the pores. This was still a manual process, but it didn’t take terrible long. In fact, the capture looked extremely good, as can be seen in Figure 2:

Figure 2: Particle Capture in UF ladder with 1 mg/mL BSA. The particle capture appeared consistent with expected results in 0% UF (A), 20% UF (B), 50% UF (C), 65% UF (D) and 85% UF (E). Upon inspection of a fractured membrane, the particle retention in the pores can be observed with two particles captured in cross-section. Furthermore, the bowl-with-hole structure of the pores in evident.
Why did this process work? Well, the theory is that adding BSA to the gold will help to form a protective corona around the nanoparticles (Figure 3). While the BSA will not bind to the surface of the gold, it will still remain present around the whole particle, providing a potential buffer to prevent particles from sticking to each other and therefore aggregating.
Figure 3: BSA Protection of Gold Nanoparticles. By adding BSA in low concentrations (1 mg/mL) to the gold nanoparticle solution (A), the theory is that a protective buffer zone will form around the particles, preventing them from aggregating (B).
While the schematic may not be exactly accurate, this provides a helpful representation of what could possibly be occurring upon the addition of BSA. Furthermore, this data ties into the experiments that Dan has performed and that you can see in his post (Dan, you had better be grateful for all the attention I’m giving you).
Now, we have finally wrapped up this Aim with only a few minor things left to complete. Hopefully very soon, you’ll be able to see all of this work come to fruition in Dan’s and my new paper: Critical Flux and Particle Capture on Nanoporous Silicon Nanomembranes: The Story of Dan Ahmad and Kilean Lucas and Nobel Prize Winning Science. (Seriously though, we are working on a manuscript related to the concepts of critical flux and particle capture theory on our membranes.)
Before I leave you all today, I left out the juiciest part until the very end so that you would have to read through everything to get to the good stuff: how did the actual quantification of these experiments go? Well, this is how:
Figure 4: Comparison of Experimental and Model Capture. The data from the experimental validation experiments is plotted (orange, triangles) with the predicted results from the COMSOL model (blue, circles) along with the standard error of mean. The experimental results are lower than predicted for the 20% condition, but are in very good agreement at data points above 50% UF. However, the 85% condition has ~15% SEM, showing that those experiments do vary quite a bit.
This is amazing! After double and triple checking my counts and my math, the results are very similar to what my model predicts. This means that I can finally leave this behind and move on to the more important biological components of my thesis! Move aside Alec, I’m coming for that hood!