Strutting the Runway: Modeling the Microfluidics and Reaction Kinetics of the μSiM-DX
The development of the μSiM-DX has been swift and focused, as discussed in these previous blog posts: https://trace-bmps.org/beadazzled-laying-the-foundation-of-the-%ce%bcsim-dx-fouling-based-sensor/ and https://trace-bmps.org/vindictive-virus-capture-testing-the-%ce%bcsim-dx-with-vaccinia-virus-towards-a-modular-virus-diagnostic/. To provide a greater understanding of the inner workings of the device, I have done a few calculations regarding some of its working properties related to microfluidics. The three I present here are about the relationship between pore occlusion and the hydraulic resistance of the membrane and an analysis of affinity-based capture systems within the μSiM-DX. These are “back of the envelope” calculations and are not meant to be taken as an extensive analysis of the microfluidics of the μSiM-DX.
Calculation 1: Pore occlusion and membrane resistance
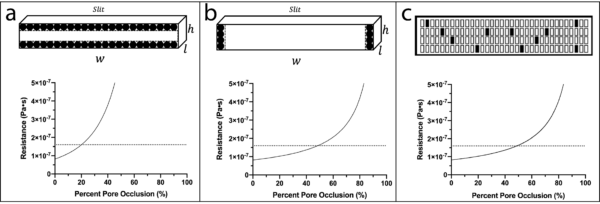
In order to determine how the resistance of a porous membrane changes while being occluded, the analysis below was completed on a microfluidic device (gasket layer TFAC device) that is similar to the μSiM-DX which used a one window, 0.5 μm slit pore membrane. In each analysis, shown in Figure 1, all dimensions (height, width, length) but one are held constant to observe how the unconstrained dimension individually affects the total membrane resistance. In doing so, trends are observed on how the total membrane resistance is affected by each dimension. The length dimension is not analyzed in this analysis, since it is the least likely to clog in actual capture. Instead, total pore occlusion via the number of available pores is analyzed. The resistance through each slit is modeled using the Hagen-Poiseuille equation for a rectangular shaped channel. Resistance values are determined via the following calculations with their results shown in Figure 1. The height and width analyses assume uniform pore occlusion across every slit in the porous window, while the pore occlusion analysis assumes 100% occlusion of pores. While no analysis is perfect, together they suggest that total membrane occlusion is not necessary in order to trigger a resistance switch.
Dimensions
Top channel dimensions: L = 15000 μm, w = 1000 μm, and h = 100 μm
Dimensions of a single slit in the membrane: L = 0.4 μm, w = 50 μm, and h = 0.5 μm
The viscosity of water at 25 °C (μ) = 8.9×10⁻⁴ Pa•s
Number of pores in a window
Number of pores in 1 window = (Percent Porosity • Membrane Area) / Area of a single pore
= 8400 pores
Channel to the indicator port resistance (remains constant for every analysis)
Indicator port channel resistance = (12 • μ • L) / w • h3
= 12 • 8.9E-4 Pa•s • 15000 μm / 1000 μm • (100 μm)3
= 1.602E-7 Pa•s/μm3
Membrane resistance (representing the minimum membrane resistance)
Resistance of a pore: Rp = (12 μL / (1-(0.63(h / w))) w • h3
= (12 • 8.9E-4 Pa•s • 0.4 μm) / (1- (0.63(0.5 μm / 50 μm))) • (0.5 μm3)
Membrane resistance: Rm = Rp / (total number of pores)
= 8.189E-8 Pa•s/?m3
Height analysis
Decrease the height dimension when calculating the resistance of a pore with 0.01 μm steps. Calculate and plot the membrane resistance as a function of percent pore occlusion. The membrane resistance crosses and becomes greater than the resistance of the indicator port channel at ~20% pore occlusion of all of the pores within the porous window.
Width analysis
Decrease the width dimension when calculating the resistance of a pore with 1 μm steps. Calculate and plot the membrane resistance as a function of percent pore occlusion. The membrane resistance crosses and becomes greater than the resistance of the indicator port channel at ~50% pore occlusion of all of the pores within the porous window.
Open pore number analysis
Decrease the number of pores within the membrane when calculating the resistance of the membrane with 1 pore steps. Calculate and plot the membrane resistance as a function of percent pore occlusion. The membrane resistance crosses and becomes greater than the resistance of the indicator port channel at ~50% pore occlusion of all of the pores within the porous window.
Calculation 2: Biotin-avidin affinity-based capture calculations
The following calculations were done to determine the amount of time an avidin bound molecule would have to stay within the pore of a silicon nanomembrane in order to have the chance to interact and bind to a biotin coating on the wall of the pore.
Fluid flow rate
Injection time = 8 sec
Sample volume = 40 μL ≡ 4E10 μm3
= 5E9 μm3/sec
Fluid flow rate within a pore
Pore area = 1 μm • 50 μm= 50 μm2
= 4620 pores
= 10822.5 μm/sec ≡ 10.8 mm/sec
Residency time within a pore
Membrane thickness = 0.4 μm
Residence time within a pore = 0.4 μm / (10822.5 μm/sec)
= 3.7E-5 sec ≡ 37 μsec
Streptavidin conjugated antibody concentration
Streptavidin conjugated antibody concentration = 0.185 μL * 1.06E-4 μg/μL
= 1.961E-11 g / 150000 g/mol
= 1.307E-16 mol
Streptavidin conjugated antibody concentration = 1.307E-16 mol / 0.04 L
= 3.268E-15 M
Kode™ molecule concentration across 2 windows
Solid surface area of a single pore = 2(1 μm • 0.4 μm) + 2(50 μm • 0.4 μm)
Number of Kode™ molecules within the pores of 2 windows = 3.76992E11 Kode™ molecules
Molecular mass of Kode™ Biotin = 2057.34 g/mol ≡ 3.4175E-21 g/Kode™ molecule
Mass of Kode™ molecules within the pores of 2 windows = 3.76992E11 Kode™ molecules • 3.4175E-21 g/Kode™ molecule
Moles of Kode™ molecules within the pores of 2 windows = 1.288E-9 g / 2057.34 g/mol
Kode molecule size = ~7 nm = 0.007 μm (Korchagin et al., Carbohydrate research, 2012, 356, 238., William et al., International journal of molecular sciences, 2016, 17, 118.)
Volume within the vicinity of Kode™ molecules in a single pore = 2(1 μm • 0.4 μm • 0.007 μm) + 2(50 μm • 0.4 μm • 0.007 μm)
Total volume within the vicinity of Kode™ molecules across 2 windows = 0.2856 μm3 • 9240 pores
Kode™ molecule concentration across 2 windows = 6.26E-13 mol / 2.639E-12 L
Concentration of biotin-avidin complexes
Streptavidin-Biotin affinity constant (Ka) = 2.5E13 M-1 (Deng et al., Journal of the American Society for Mass Spectrometry, 2013, 24, 49-56.)
[AB] = 0.0194 M
Time required for a streptavidin-biotin complex to form
Streptavidin-Biotin on rate (kon) = 1.3E8 M-1 • sec-1 (Deng et al., Journal of the American Society for Mass Spectrometry, 2013, 24, 49-56.)
Time required for a streptavidin-biotin complex to form = 1.3E8 M-1 • sec-1 • 0.0194 M
= 2520354.7 sec-1 = 3.968E-7 sec ≡ 0.3968 μsec
Calculation 3: Antibody-antigen affinity-based capture calculations (assuming similar conditions as above)
These calculations are a follow-up to Calculation 2 which was done in order to determine the amount of time a protein antigen would have to stay within the pore of a silicon nanomembrane in order to have the chance to interact and bind to an antibody coating on the wall of the pore.
Concentration of antibody-antigen complexes
Median antibody-antigen affinity constant (Ka) = 66E12 M-1 (Landry et al., Journal of immunological methods, 2015, 417, 86-96.)
66E12 M-1 = [AB] / 7.755E-16 M2
[AB] = 0.0512 M
Time required for an antibody-antigen complex to form
Average antibody-antigen on rate (kon) = 1E5M-1 • sec-1 (Landry et al., Journal of immunological methods, 2015, 417, 86-96.)
Time required for a protein-antibody complex to form = 1E5 M-1 • sec-1 • 0.0512 M
= 5118.3 sec-1 = 1.954E-4 sec ≡ 195.4 μsec
Conclusions
These calculations revealed that the relationship between membrane resistance and membrane occlusion is not linear. Membrane resistance increases as more of its pores are occluded, but the response lags behind its percent pore occlusion until an inflection point is reached. For the μSiM-DX resistance switch, it also supports the idea that total membrane occlusion is not necessary to trigger a resistance switch within the device. With regard to the affinity-based capture system within the μSiM-DX, the calculations also show the importance of the biotin-avidin interaction. The residency time within a pore of the membrane is only 37 μsec. Antibody-antigen binding on average requires 195.4 μsec to occur, meaning that at our current human controlled flow rate, the interaction does not have enough time to occur. Either a much slower, most likely machine controlled flow rate would have to be used, or some sort of a recirculating fluidic design would have to be incorporated within the device. The biotin-avidin system only requires 0.3968 μsec to complete binding, highlighting its importance within our current μSiM-DX system.
Future Work
Moving forward, more in depth modeling of the μSiM-DX could be done. This should provide more evidence for the results of these calculations and overall provide a greater understanding of the system. This could be done in COMSOL or through more of a direct mathematical approach. Either approach will have to take into account the microfluidics of the μSiM-DX and the reaction kinetics of the affinity-based capture system.