Immune Checkpoint Therapy – EV Analysis
Introduction & Motivation
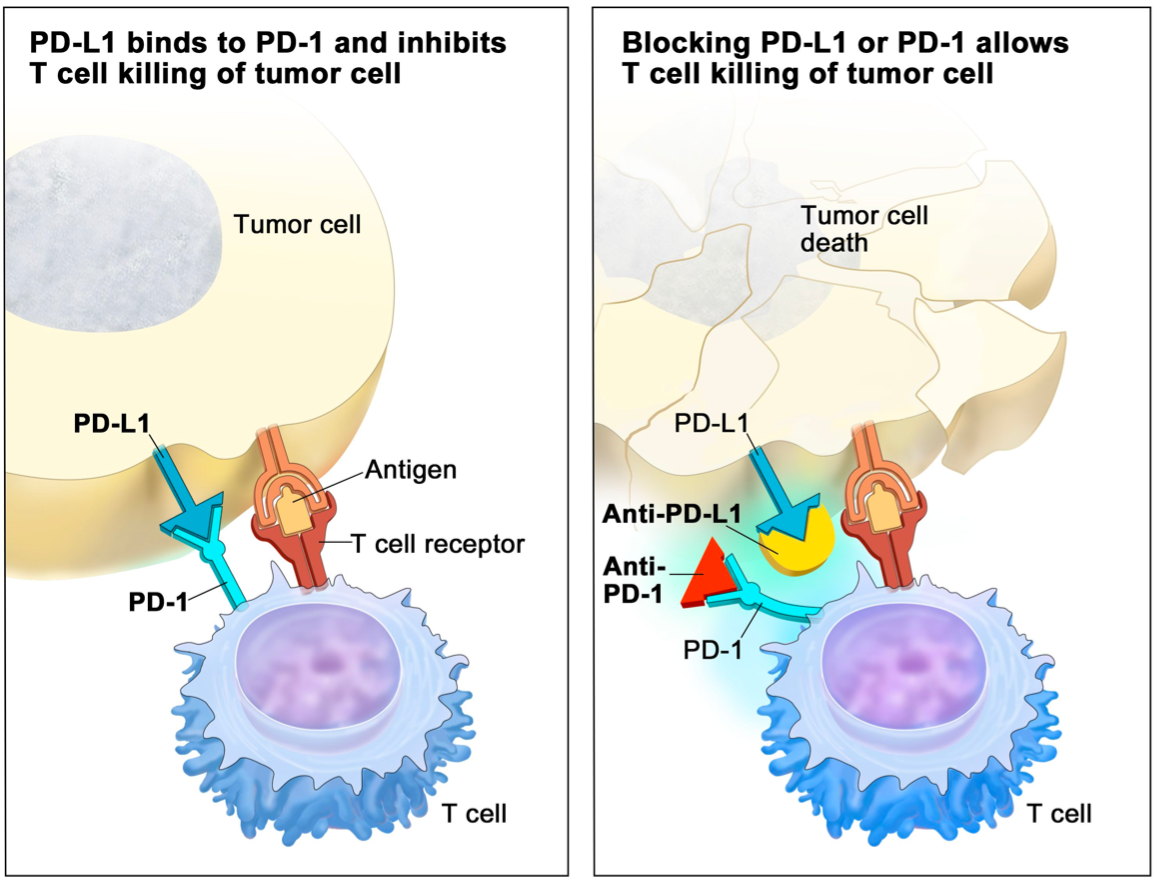
A subset of cancer cells has mutations that generate proteins recognized by the immune system as foreign, triggering the immune-mediated clearance of those cells. To avoid this fate, cancer cells can evolve mechanisms to suppress this antitumor response via the regulation of immune checkpoint pathways. Immune checkpoints describe mechanisms that are in place to regulate immune function and prevent an immune response to healthy cells. Tumor cells can directly overexpress inhibitory immune checkpoint molecules and induce the expression of these proteins in cells within the tumor microenvironment. These inhibitory proteins interact with receptors on antitumor immune cells, suppressing their response and facilitating tumor evasion of immune surveillance. One such example is the Programmed death-ligand 1 (PD-L1): Programmed cell death protein 1 (PD-1) axis; PD-L1 overexpressed on tumor cells can bind to its receptor, PD-1, on the surface of T cells and inactivate these cells thus protecting themselves from T-cell-mediated cytotoxicity (Figure 1 [1]). Immune checkpoint therapy (ICT) acts to block PD-L1 or PD-1 using monoclonal antibodies, preventing their interaction in aims to rid tumor cells of this evasion mechanism.
ICT shows remarkable promise for treating cancer patients; however, response rates are low. As these therapies are costly and generate significant side effects, identification of patients who will respond to ICT is a pressing clinical need. The current gold standard in selecting ICT participants is immunohistochemistry (IHC) investigating PD-L1 expression in tumor biopsies although, PD-L1 IHC is predictive of responses in only ~29% of cases [2]. It has been postulated that this is due in part to small unrepresentative biopsies that sample multiple cell types and ultimately do not account for inter and intra-tumoral heterogeneity as well as the inability to sample metastatic lesions. This has motivated the need for blood-based biomarkers since this will “sample” the entire body and measurements can be taken often using non-invasive methods.
In a study examining total serum levels, baseline PD-L1 measurements were correlated to treatment response among melanoma patients [3]. In recent years it was found that PD-L1 is not only overexpressed on tumor cells but can also be overexpressed on tumor-cell-derived extracellular vesicles (EVs), more specifically, the exosome subpopulation [4]. In the case of melanoma, levels of exosomal PD-L1 were correlated with tumor burden in mouse-xenograft models and the degree of in vitro CD8+ T cell suppression. Additionally, exosomal PD-L1 was effectively used to discriminate immune therapy treatment responders from non-responders using both pre-treatment levels and dynamic measurements made over the course of therapy [4].
For this reason, we sought out to assess EV PD-L1 and PD-1 levels in plasma samples using the ALine capture device referred to as the ‘catch and display liquid biopsy’ (CAD-LB). The CAD-LB interrogated plasma samples from a healthy control, a bladder cancer patient that has undergone anti-PD-L1 therapy (Atezolizumab), and a bladder cancer patient that has undergone anti-PD-1 therapy (Pembrolizumab). Plasma samples were labeled with antibodies targeting PD-L1 and PD-1, and colocalization with our general EV label (CFSE) was evaluated.
Results & Discussion
Figure 2 presents the comprehensive results of plasma sample labeling with PD-1 and PD-L1 and their respective isotype controls: rabbit IgG and mouse IgG. Results are presented in terms of “percent positive EVs” which describes the percentage of CFSE-labeled EVs that are colocalized with antibody signals.
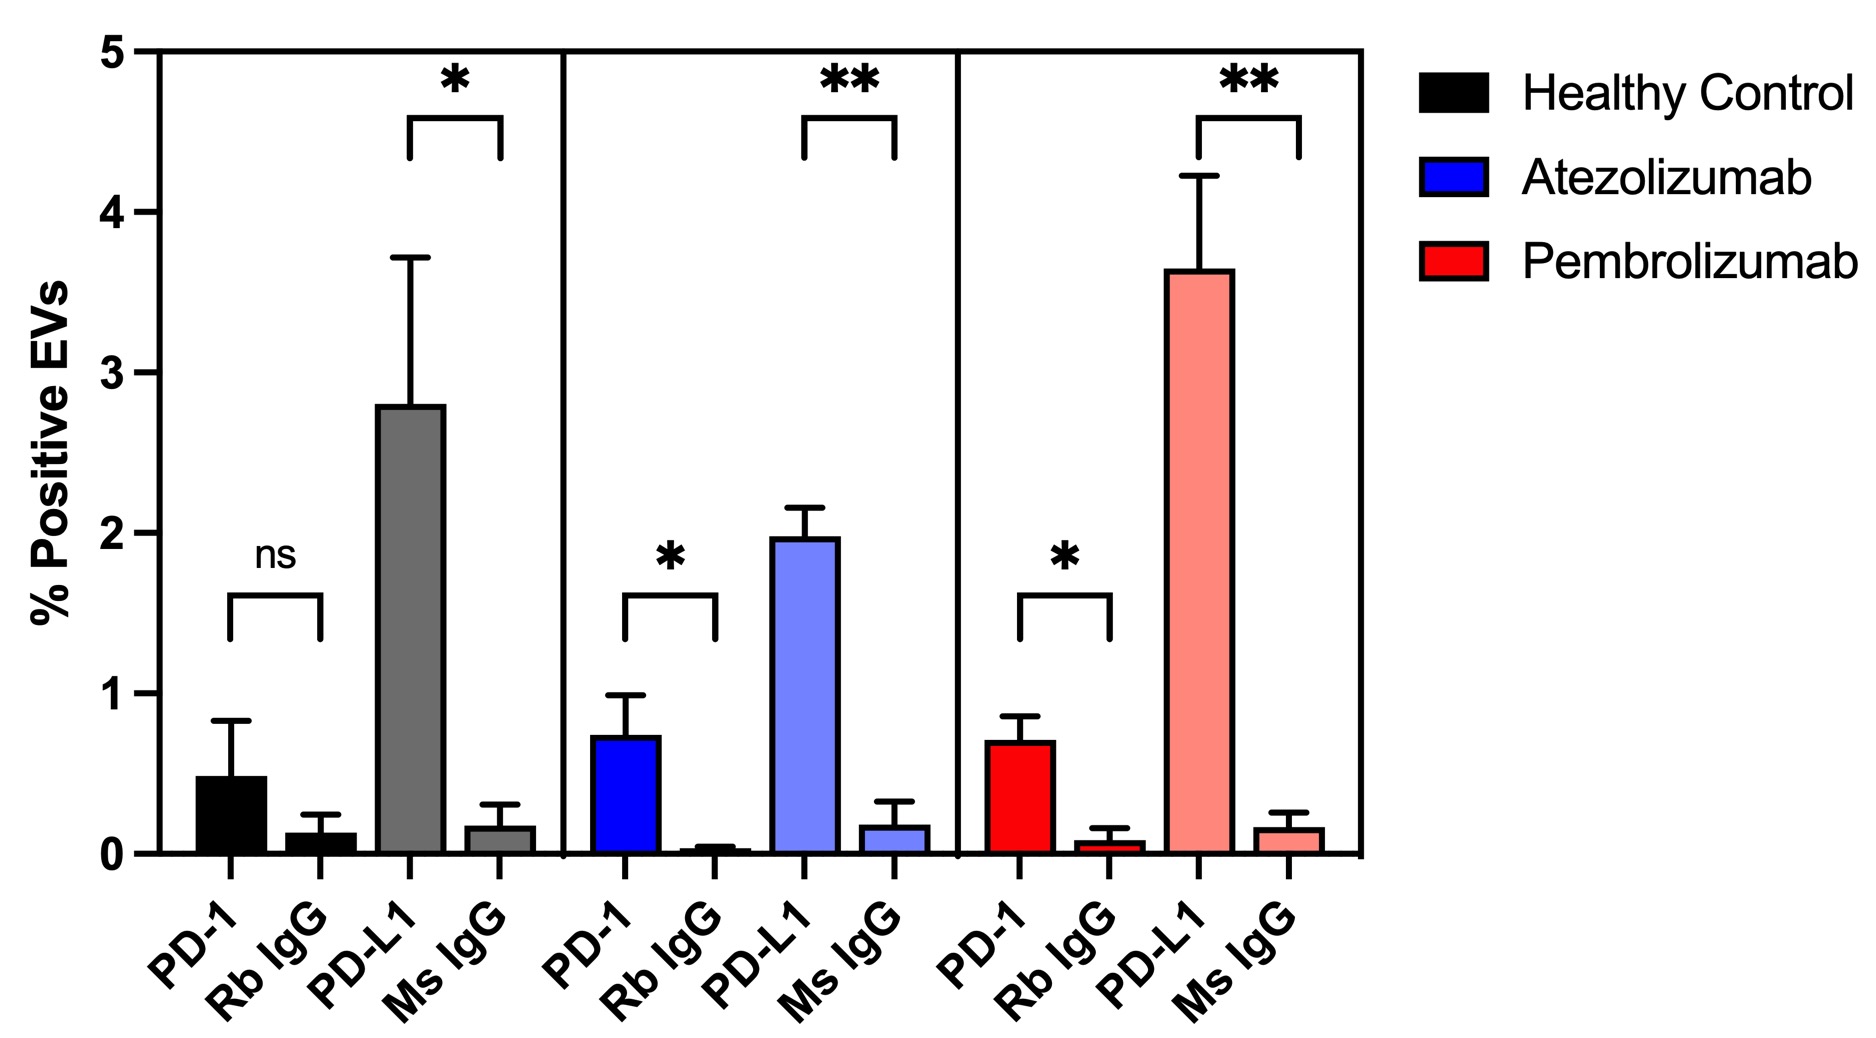
It can be seen that target antibody signals are significantly higher than isotype controls, except for the case of PD-1 in the healthy control. This is exciting as it appears the CAD-LB can detect rare biomarkers in plasma above the level of isotype controls. Furthermore, the fact that PD-L1 colocalization is higher than that of PD-1 across subjects is encouraging since more cell types express the former.
It is challenging to make comparisons between healthy individuals and those receiving ICT since this data only includes technical replicates of single donors and is not representative of treatment groups or matched healthy donors. Additionally, we do not know at what point samples were collected relative to the start of treatment as well as the patients’ responses. It would be valuable to acquire more donors, with information regarding treatment outcomes, and incorporate dynamic sampling in which biomarker levels could be evaluated periodically.
Another benefit of the CAD-LB is the ability to multiplex biomarkers. This means that additional antibodies can be used to identify a vesicle’s cell of origin; in doing so, we can determine the source of different biomarkers. For instance, by examining an antibody targeting CD3 (Figure 3), a general T cell marker, we can propose that EVs colocalized with these signals are likely T-cell derived.
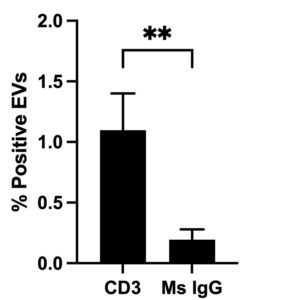
In the case of the healthy control, CD3+ EVs can be detected above isotype control. This could be useful as multiplexing PD-1 and CD3 may allow us to determine the proportion of PD-1 that is native to T cells and the proportion that is derived elsewhere. Furthermore, other T cell markers indicative of T cell activity: senescence, exhaustion, or Treg immune suppressor cell identity could be informative in our studies of immune therapy monitoring.
In our next steps, we wish to multiplex biomarkers as well as expand our biomarker panel. Through bladder cancer patient recruitment, we will aim to test the sensitivity of EV biomarkers in detecting tumors of various stages and evaluate the predictive power of the CAD-LB relative to ICT responsiveness.
References
[1] NCI dictionary of Cancer TERMS. National Cancer Institute. (n.d.). Retrieved September 2021, from https://www.cancer.gov/publications/dictionaries/cancer-terms/def/immune-checkpoint-inhibitor.
[2] Nimmagadda, S. (2020). Quantifying PD-L1 expression to monitor immune checkpoint therapy: Opportunities and challenges. Cancers, 12(11), 3173. https://doi.org/10.3390/cancers12113173
[3] Ugurel, S., Schadendorf, D., Horny, K., Sucker, A., Schramm, S., Utikal, J., Pföhler, C., Herbst, R., Schilling, B., Blank, C., Becker, J. C., Paschen, A., Zimmer, L., Livingstone, E., Horn, P. A., & Rebmann, V. (2020). Elevated baseline serum PD-1 or PD-L1 predicts poor outcome of PD-1 inhibition therapy in metastatic melanoma. Annals of Oncology, 31(1), 144–152. https://doi.org/10.1016/j.annonc.2019.09.005
[4] Chen, G., Huang, A. C., Zhang, W., Zhang, G., Wu, M., Xu, W., Yu, Z., Yang, J., Wang, B., Sun, H., Xia, H., Man, Q., Zhong, W., Antelo, L. F., Wu, B., Xiong, X., Liu, X., Guan, L., Li, T., … Guo, W. (2018). Exosomal PD-L1 contributes TO immunosuppression and is associated with anti-pd-1 response. Nature, 560(7718), 382–386. https://doi.org/10.1038/s41586-018-0392-8