Diffusion Time Dependence
The following is a plot of rhodamine diffusion for the experimental system at various time point:

In this figure, the rhodamine approaches equilibrium, as defined as a filtrate/retentate value of 1. The 9x well chips have a larger active area and quicker diffusion.
I have performed simulations of this system using COMSOL, and in this figure I’ve overlayed the results of the simulations as dotted lines on the previous experimental plot:
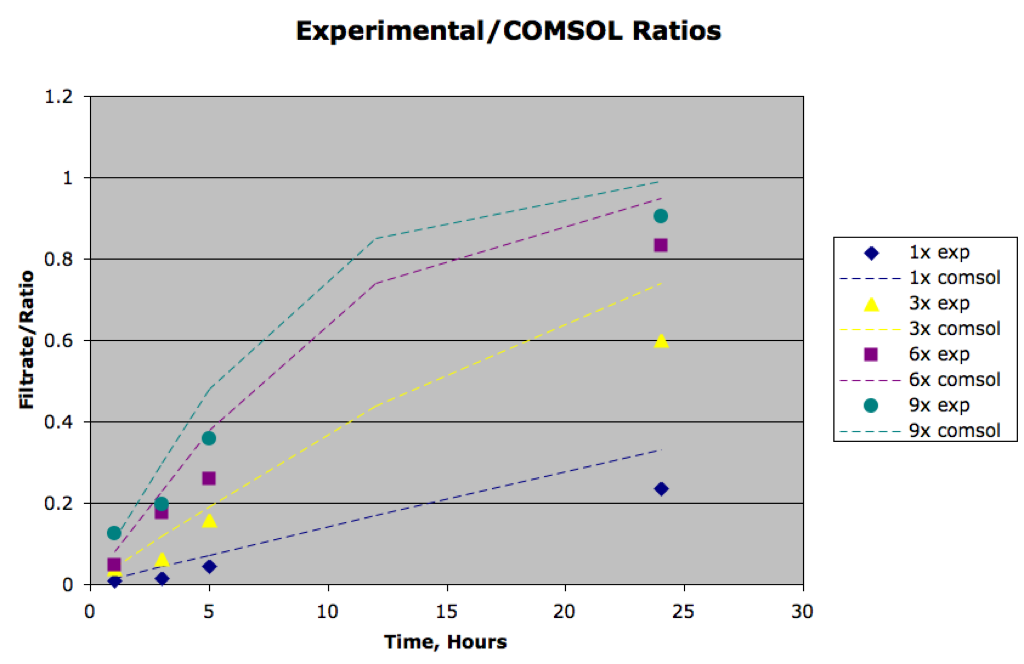
The direction of the trends are similar, but the model predicts faster diffusion. I’ve considered that I may be defining the effective diffusion coefficient incorrectly, so I determined a diffusion coefficient that better lines up the model with the experimental, as can be seen in the next figure:

DM in this figure is 7.5e-14 m2/s, as compared to the calculated 1.1e-11 m2/s. The system is fairly insensitive to DM, and a large change is required to really shift the ratios. By taking into account charge effects by a rough Debye length treatment, I can reduce DM by one order of magnitude, but not as low as would be required to match experiments.
Currently I’m retrying experiments using rhodamine that has been treated for aggregates in case that’s the problem.
UPDATE:
1. Spinning rhodamine to remove aggregates does not change the experimental sieving.
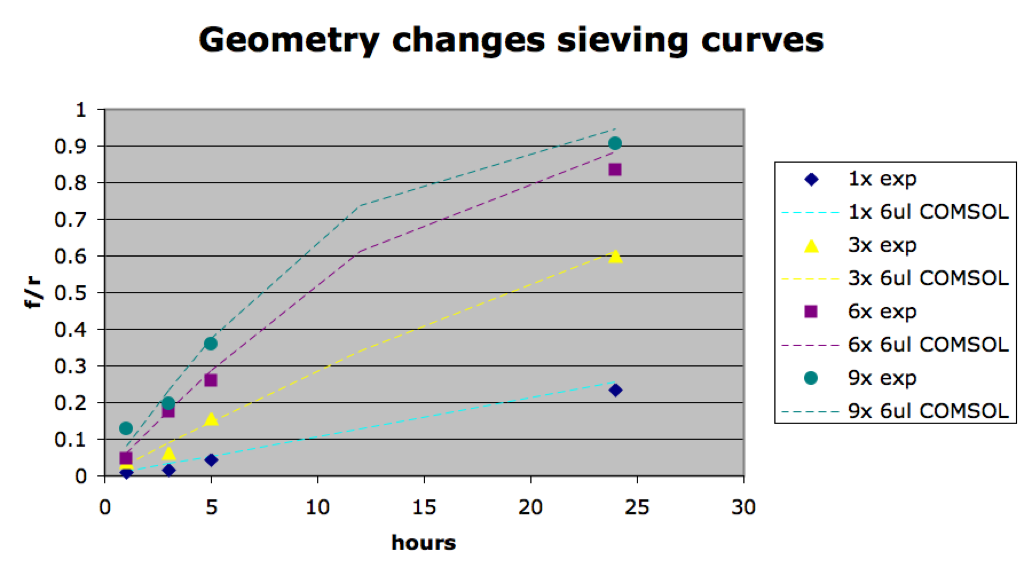
2. Slight geometry changes move the sieving curves more than changing diffusion coefficient. In the following chart I’ve added 6 ul to both the filtrate and retentate, and this better fits the model. I will rigorously check the geometry in the experimental system once I get a chance.
Update:
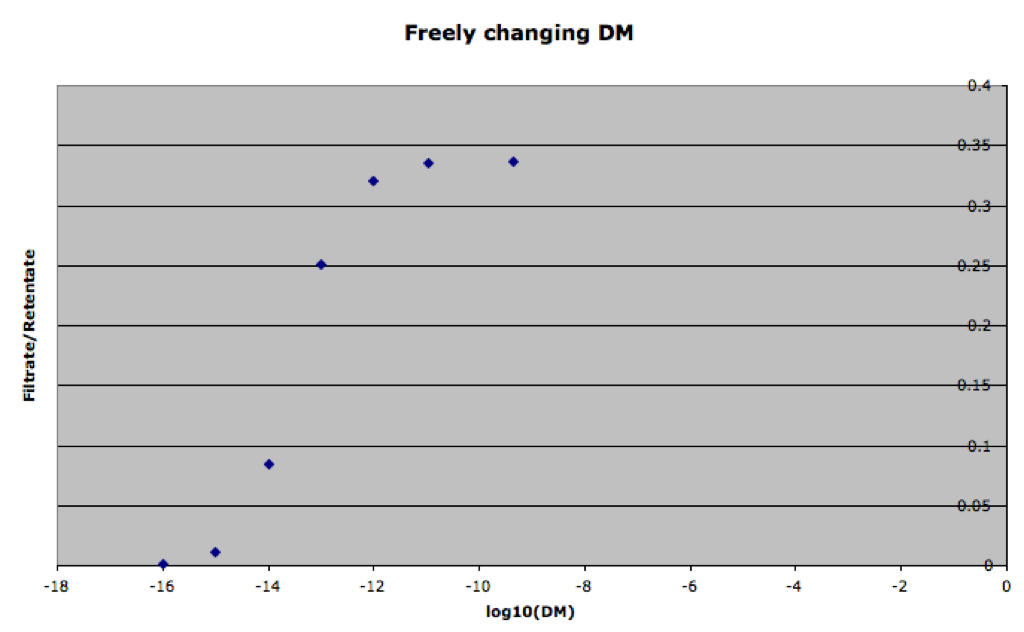
As per Philippe’s suggestion, I have made the following semi-log plot of the ratios at 24 hours with a 1x chip for different values of DM. A familiar looking sieving curve is obtained (keep in mind that the lower DM should correspond to a larger sized molecule). Hopefully we’ll see similar trends when simulating protein diffusion.
This is very nice and interesting. Your relative insensitivity to DM suggests that you have to make sure the geometry of the experiments is reflected precisely in the simulations. Also, could you look at what happens as DM is freely adjusted, from say zero to a much higher value than your original value?
I think this simulation confirms the various NRG discussions about geometry being important, and likely more important than the membrane properties for an unstirred cell with very small membrane area.
What volume of retentate and filtrate did the simulation originally use before you added the 6uL to each side? How do these volumes compare to the actual experiment?
I’m also curious about how you measure the concentration of the filtrate/retentate in your experiments. I assume that you stir up both sides as best you can to homogenize the solutions – how effective do you think this process is? The simulation probably uses the exact mass on each side and divides this by the volume? It would be nice to have some feeling for the contribution of each source of error in the measurements.
Chris, you make another good point- let’s assume that the membrane is some other membrane, for example a polymeric membrane- can we input its estimated DM and see whether the results come out very differently- i.e., separation is much slower? This would be a strong result.
No stirring in the model or simulation. Accurately modeling this would be too difficult because we would never know the thickness of the boundary layer. Unfortunately, if we are so insensitive to Dm, then we don’t really have a check on the sieving model.
I guess the check on the sieving model will come with larger molecules, proteins? Smaller free diffusion coefficients and more hindrance when they pass through the pores.
Philippe, I’ve added a chart to the post that illustrates what happens when DM is freely changed. This results in something similar to the sieving curves we see for protein separations.
Chris, the retentate and filtrate are both set at 20 uL initially because this accurately represents the experimental system. To measure the experimental system, I’m just pulling of 3 uL of solution from top and bottom. This will mix the solution slightly, but I am not specifically trying to homogenize the solutions before measuring. The COMSOL ratios are obtained by integrating the number of moles on both sides of the membrane, so yes this would relate to a completely homogenized system.