Affinity Based Capture of Streptavidin Conjugated EVs on the ALine
This post is a continuation of the affinity based capture of streptavidin conjugated EVs. The difference is that instead of using the tangential flow system we used the ALine devices. Sam’s previous work discussed the use of ALine devices for size based capture of EVs, but in this case we wanted to try the streptavidin-biotin affinity capture using micron slit membranes.
For these experiments we used the Hansa lyophilized exosomes from HCT116 cell line and prelabeled them with CFSE and streptavidin conjugated PD-L1. For the ALine devices, 0.5 um and 1um slit membranes were tested. As a control, three 0.5um slit membranes and three 1um slit membranes were left uncoated (non-biotinylated). Three replicates of the 0.5um and 1um slit membranes were used for the biotinylated group. A total of 40 uL from a concentration of ~107 of the EV-antibody solution was pipetted into the ALine device over a period of 8 seconds, giving us an input concentration of ~106 EVs. A more detailed protocol on how to coat the membranes and label the EVs, can be found in the following link.
Results
As previously mentioned in the affinity based capture post, we can once again observe in Figure 2 that there was much more EV capture in the 1um non-biotinylated membrane than the biotinylated membrane, and larger particles/aggregates are present as well. Figure 3 shows the quantification of particles with an average size of 4um and it excludes larger particles/aggregates. The graph shows that there is lower EV capture with the 1um biotinylated membrane than the non-biotinylated one, but when compared to the 0.5um slit membrane there is a significant difference in EV capture. This further confirms that there’s size-based capture occurring in the 0.5um membrane instead of affinity-based capture.
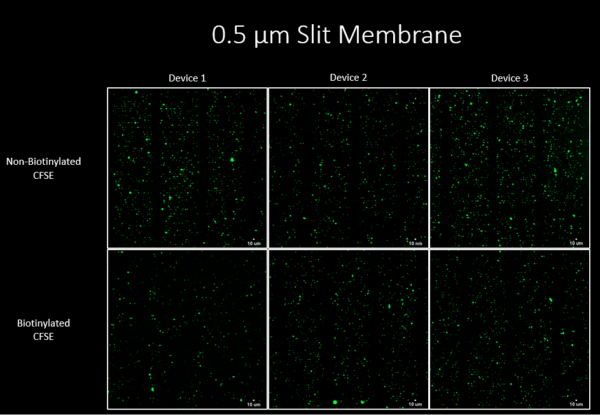

Figure 1 also shows that the 0.5um non-biotinylated membrane had higher capture than the biotinylated membrane, and this can be further confirmed with Figure 3 where the average CFSE count is higher for the 0.5um non-biotinylated membrane.

In Figure 3, we can conclude that the 0.5um membrane shows higher EV capture than the 1um membrane. This is also confirmed on Figure 4, where the non-biotinylated and biotinylated 0.5um membrane has a higher amount of total number of particles captured compared to both groups using the 1um membrane. The CFSE quantification reveals that approximately 104 – 105 of the particles are being captured, this is one to two orders of magnitude lower than the input concentration of ~106 EVs. Figure 3 and 4 suggests that the capture based on affinity might require a longer injection time in order for the biotin-streptavidin binding to occur.
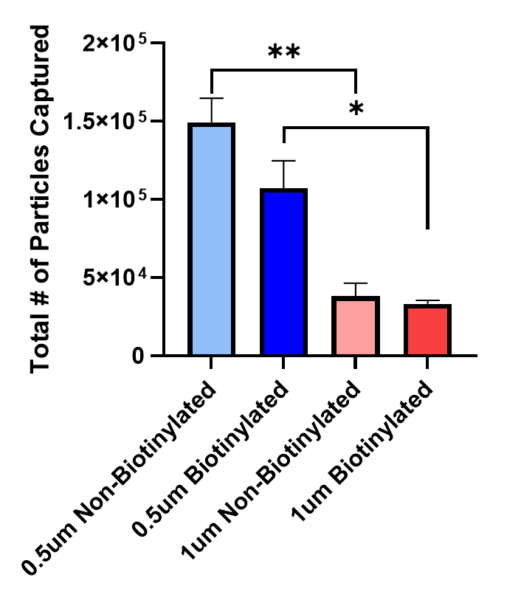
In conclusion, it can be confirmed that the 0.5um slit membrane is more successful at EV capture than the 1um slit membrane. Although, we can observe that size-based capture could be occurring more often than affinity-based capture. Since the 1um biotinylated membrane did not show much CFSE signal, it can be concluded that the affinity-based capture is not occurring at an injection time of 8 seconds. The average CFSE quantification also shows that there are less particles being capture than the amount that had been injected initially, this could be due to the change from the tangential flow system into the ALine device. Further experiments are necessary in order to include a proper isotype control and to address the differences observed between non-biotinylated and biotinylated membranes. Also, prefiltration might be necessary in order to avoid larger particles/aggregates.