Serial Dilution of Rhodamine
I ran a series of serial dilutions with the rhodamine, to find the absorbency using the spectrometer. Below is a graph of the concentration of rhodamine versus the absorbency. I removed the concentrations which had absorbances greater than 1.7 AU because those absorbencies created a greater deviation. The lower concentrations show a more linear distribution. The lowest concentration I tested for these dilutions was 6uM however the readings were within the error of the spectrometer (+/- .003 AU).
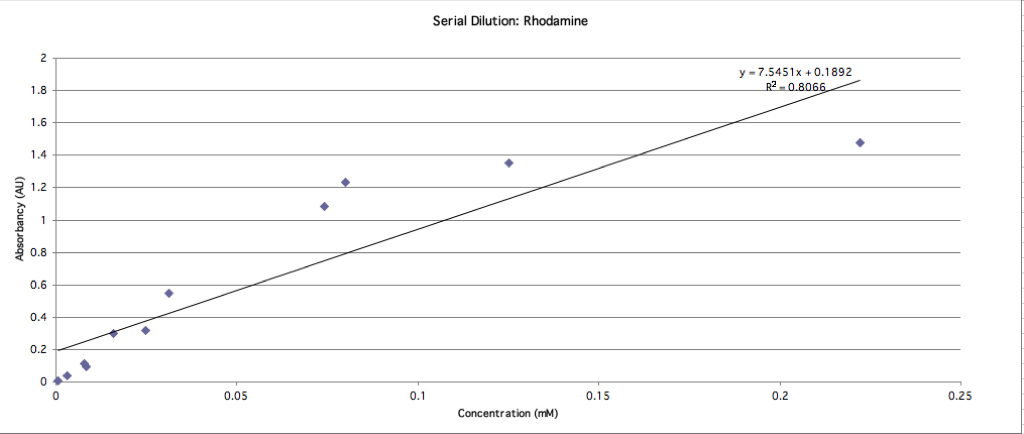
When I run the stir cell with Rhodamine, I can use the concentration curve to find the concentration of the stir cell which corresponds to the absorbency reading of the rhodamine.
This should be linear, so I would remove any data beyond 1.2. Still, there seems to be a little noise in the data that deviates from perfect linearity. Any idea what might cause it, or is this expected from this instrument? Tom, Jess, and Jim know move about aqueous absorption measurements than I do, but I would expect a near perfect line in this regime, with a simple dye….
I completely agree with Chris. Remove the data above 1.2 – it’s clearly no longer registering the same measurement relationship at these higher concentrations. Additionally, I have heard anecdotally that these devices don’t work well above 1.0 au