C-dot separations
I performed separations using C-dots from Hybrid Silica, a silica based particle with an internal fluorescent core. The particles are coated with a PEG layer of unknown length, but the idea would be that they’d be less affected by electrostatics than gold. I used two sizes. One is marked <10 the other <30, but I think we ended up saying these were close to 10 and 22 nm (Tom correct me if I’m wrong). The 10 nm particles are Cy5 labeled and 22 nm are sulforhodamine labeled.
Separations were performed using 1:2 particles in .1M KCl (final KCl concentration of 50mM – not sure if these particles are already in a salt solution). 50mM KCl was pipetted on the backside of the membrane. 9x square membranes were from SC166 and were RTP’ed. Diffusion occurred for 24 hours.
Results (24 hours):

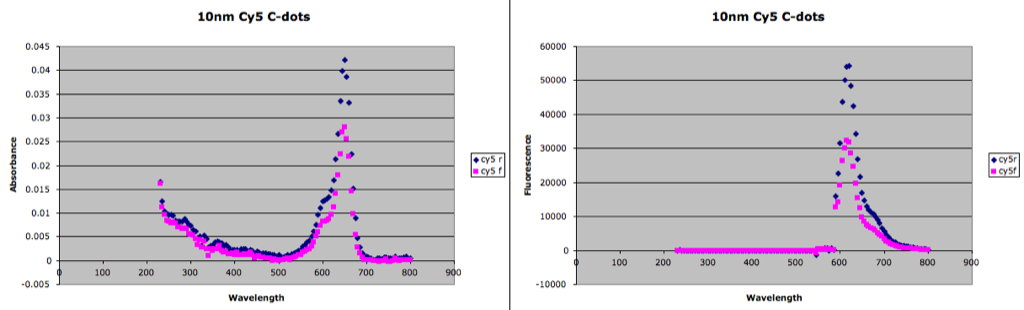
Membranes were intact. 10nm Cy5 particles readily go through in 24 hours. The concentration of the filtrate is between 58 and 66% of the retentate, depending on whether you look at the fluorescence or absorbance.
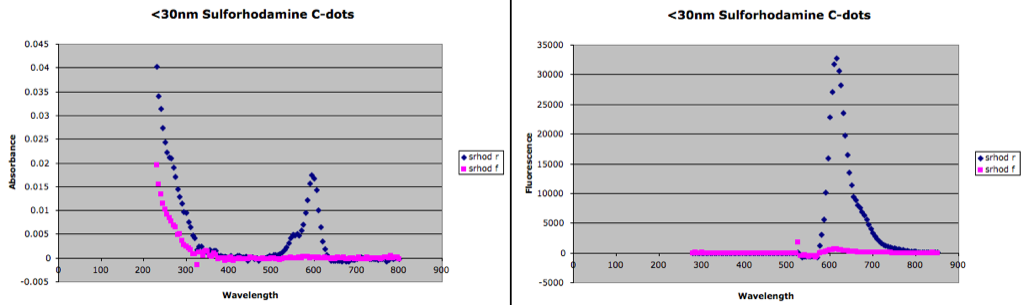
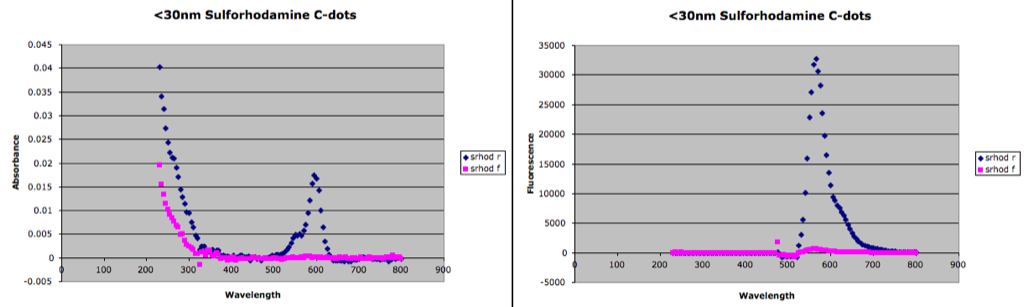
22nm sulforhodamine particles do not really go through the membranes in 24 hours. You can see a tiny peak in the filtrate that might indicate that a very small portion may have passed through, but in both cases the filtrate is 1-2% of the retentate intensity and close to the noise.
Zetasizer will not work with the Cy5 10nm dots, but here’s some data for the sulforhodamine 30nm dots:
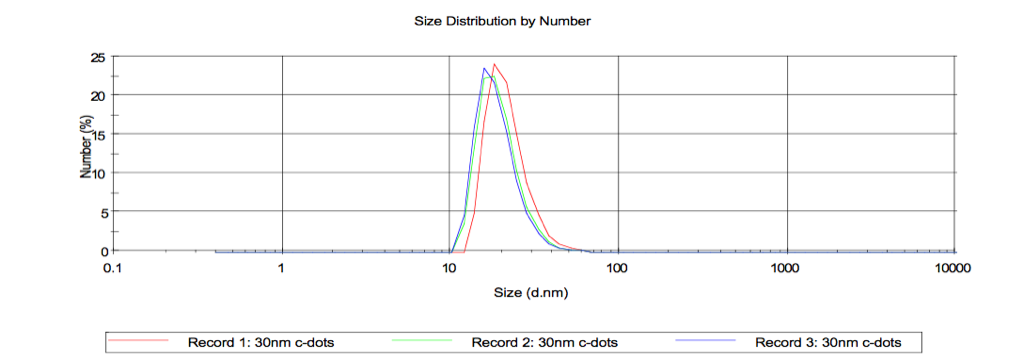
Size comes out around 20nm
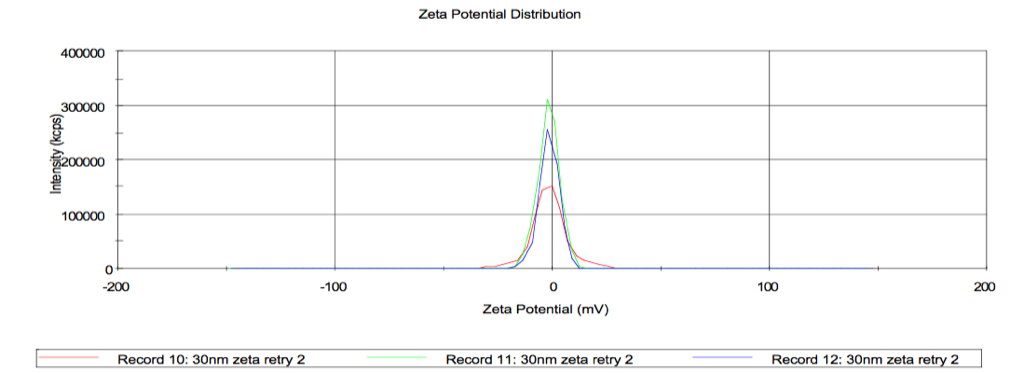
Zeta potential very close to zero. I measure -1.4.
Results (48 hours):
The separations pictured above were carried out for 2 days, and the 10nm particles are very close to equilibrium.
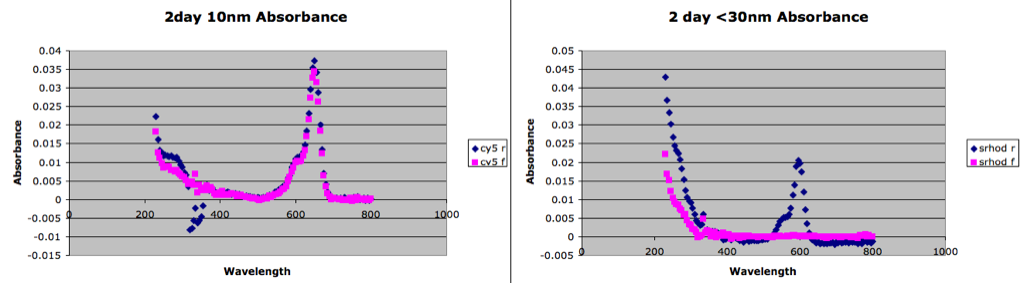
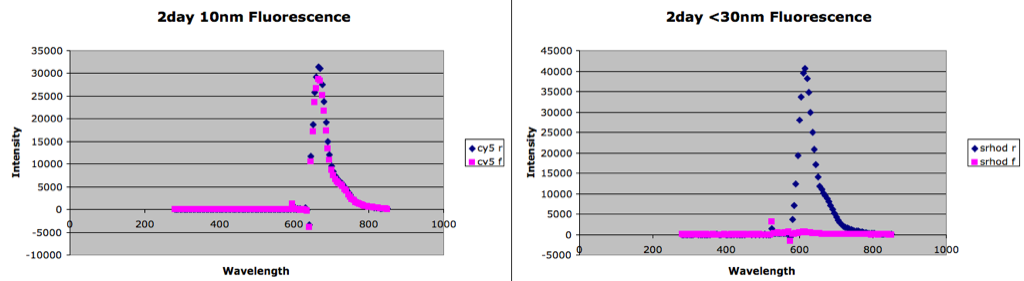
The 30nm have still not passed through the membrane to any great degree.
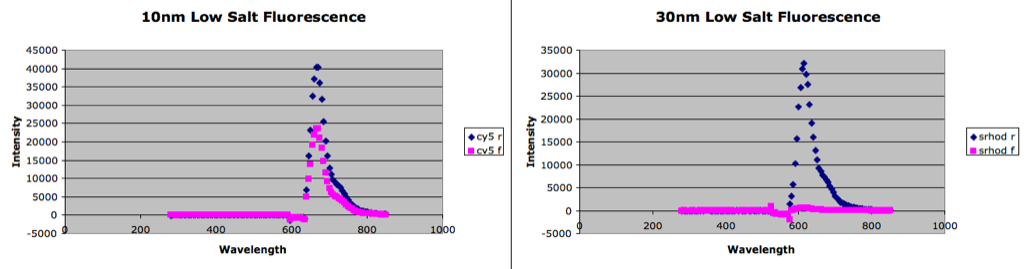
Low salt results (24hr):
The first “high salt” results were using samples dissolved 1:2 in 100mM KCl. I don’t know what the sample salt concentration was, but if it doesn’t carry any salt it is at the lowest 50mM. In these runs I cut the sample 1:2 in DI H2O, meaning they are at lowest 0mM salt.
Results are very similar to above 24hr experiment. The low zeta potential of these particles probably allows them to pass through our membrane even in low salts. Or there may be enough extra salt within the sample to reduce some of the surface potential.
10nm Cy5 results:
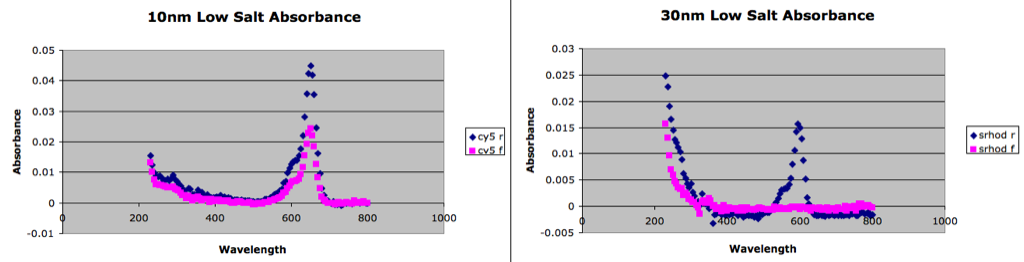
30nm Sulforhodamine results:
Finally I’ve compared the peaks of all the samples using a filtrate to retenate ratio (analogous to Zydney’s sieving coefficient):
| Particle | 24 hr Ratio | 48 hr Ratio |
| 10nm (abs) | .67 | .93 |
| 10nm (fluor) | .59 | .91 |
| 30nm (abs) | .01 | .005 |
| 30nm (fluor) | .02 | .01 |
| 10nm h2o (abs) | .54 | – |
| 10nm h2o (fluor) | .59 | – |
| 30nm h2o (abs) | .01 | – |
| 30nm h2o (fluor) | .02 | – |
Can we get a zeta potential reading on these particles to see if they are nearly neutral?
We can also put these on a grid and TEM them.
I’m guessing that the fluorescence data is fixed excitation wavelength and emission scan, right? It looks like the emission wavelengths of these particles are separated enough that you could mix the particles together, do the diffusion and be able to distinguish them in the R and F.
Fixed excitation, but the excitation wavelengths I used were different. This might work though. I’ll try some stock solutions to see if I can differentiate.
The problem with TEMing these guys is that they do have a PEG layer that lends to some “fuzziness” in the size. We can still try it and see what we get.
TEM images would be a good idea, as we have no idea what these look like (both 10nm and 30nm). The PEG layer will be visible, at least on Brian’s scope, although it won’t tell you how far the PEG stretches out in solution. You may be able to make an estimate from the Zetasizer, using the TEM data for the core size…