Purified Proteins for Separations
Link to “A closer look at separations”
We recently bought purified proteins that I will use to build a molecular weight ladder for membrane separations. I initially dissolved these proteins in salt solution and spun in an ultracentrifuge to remove aggregations. I then sized the proteins using our Malvern Zetasizer, which gives hydrodynamic radius, assuming the protein is spherical. Here is the data from the sizing (spin indicates the sample was spun at 100,000g for 20min):
beta-Galactosidase:
The Malvern Zetasizer gives us an intensity chart and a number chart. The intensity is the raw data, and larger objects have greater intensity than smaller ones. If we look at the intensity plot of beta-Galactosidase (and all other proteins I tested), the no spin sample has a small peak in the micron range. This would indicate large aggregations.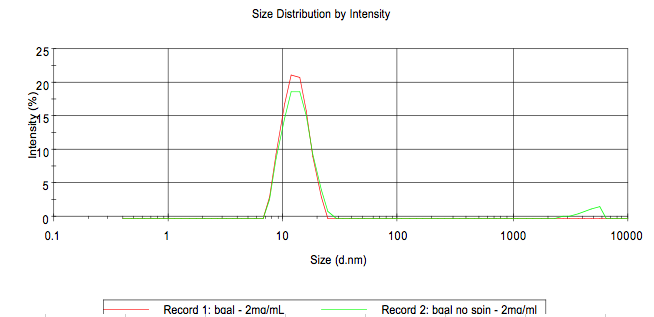
From this point on I will only show the number chart. The Malvern software has an algorhythm that calculates the number of molecules from their intensity. In these charts we don’t see any large species even if they have a higher intensity.
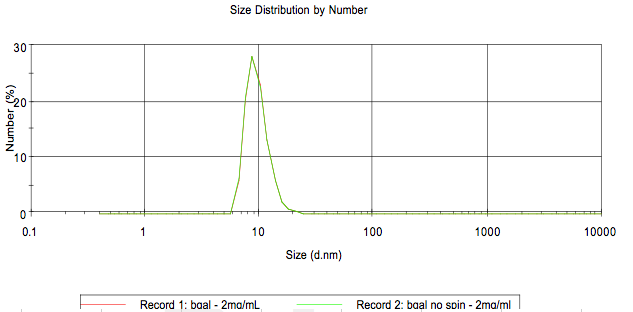
spin: 9.57 nm
no spin: 9.55 nm
pdb dimensions: 18×13 nm
size from globular assumption (based on albumin Malvern size – 5.77): 11.0 nm
Phosphorylase b:
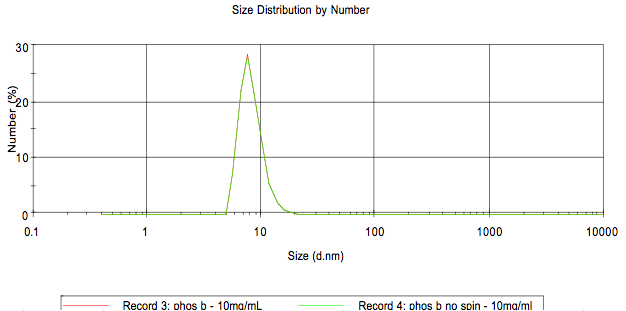
spin: 8.17 nm
no spin: 8.19 nm
pdb dimensions: 14×8 nm
size based on globular assumption: 8.22 nm
IgG:
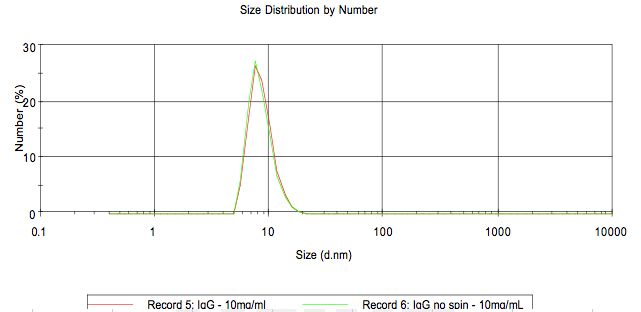
spin: 8.58 nm
no spin: 8.41 nm
pdb dimensions: 16×12 nm
size based on globular assumption: 7.19
Albumin:
Malvern size: 5.77 nm
Initial gel of these proteins: The plan is to update this post tomorrow with a better gel. The protein concentrations were much too high, and it makes it difficult to see the molecular weights. S2 is the standard that I have been using in most of my separations. It is easy to see on this 10% polyacrylimide gel that phos b and b-gal are two separate but very close bands. On previous 12% gels, these bands have overlapped. IgG is made up of heavy and light chains as indicated on the gel, and the total molecule is 150kD. I intend to add albumin (67kD) to these standards.
Jess –
You ran BSA/HSA (and IgG?) last year, right? How do those results compare?
How did the size correspond for BSA to other people’s reports of hydrodynamic radius? Is our Malvern giving data in the right ballpark? Or should we be more confident in the Malvern than existing/older data?
And just to confirm – the Malvern size is for diameter? (I remember most of the literature lists things in radius and this tripped me up before)
Thanks,
Tom
Please add one of the histograms before the spin.
We should decide if the spin step is necessary going forward. Clearly the the protein aggregates are not abundant enough to impact the average protein size, but could they still make a separation experiment harder to interpret?
Tom,
All data is for diameter. BSA was about 5.5 nm, which is also smaller than the literature reports of its diameter. The Malvern data is very reproducable, but I don’t think it exactly captures protein dimensions. I plan to run our HSA soon and add the charts to this post.
Jim,
The histograms before the spin are included on those charts. There are aggregations, but they are discounted in the number charts. I’ll add an intensity chart which makes the aggregations more obvious.
I believe the aggregations would gunk up a gel. If you’re talking about using the Malvern to determine separation results, I don’t think the aggregations would impact a single species separation. We can’t run multiple protein separations with the Malvern anyhow because of the similarity in their sizes.