Low Pressure Permeability
I retested the 100K Microcon, 100K Nanosep, and 300K Nanosep membranes at 1000RPM, which in the clinical centrifuge is 4.33psi by my calculations.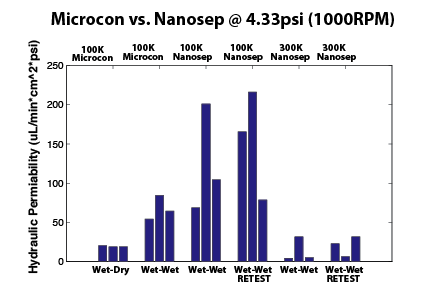 I retested the 100K Nanosep just to make sure that we had some solid permeability values. I retested the 300K Nanosep because of the extremely low permeability I calculated for the first trial.
During testing I fill the “cup” with 500uL of DI water, measure the cup height, spin the membrane at a specific RPM for a specific time (so that the height changes but it does not reach equilibrium), I measure the height at time t, and then I continue to spin the membrane for an extended period of time until it reaches equilibrium. For the 100K Microcons and Nanoseps I ran then for 3 minutes at 1000RPM and there was a measure change in cup height. For the the 300K Nanosep on the other hand I first ran them at 1000RPM for 1.25 minutes. After that time period there was no measurable change in the cup water height. I reran the membranes for an additional 2 minutes (total of 3.25minutes) and only then did I notice a very slight decrease in water height in the cup. Finding this strange I retested 3 new 300K Nanoseps under the same conditions and got the same results.
To sum up, at the same pressure and equal time, there is more water passing through the 100K Nanoseps than the 300K Nanoseps at 1000RPM.
I now that the Nanosep instruction manual has these devices rated to 14,000 times gravity, but I wonder if there is a minimal bound to their operating range; especially for the 300K. Also, is it true that the 100K and 300K Nanoseps are made out of different material? If this is true it might have something to do with performance at lower pressures.
Just to condense the bar plot above I pulled out the three largest permeability values of the possible six for both the 100K Nanosep wet-wet trial and the 300K Nanosep wet-wet trial.
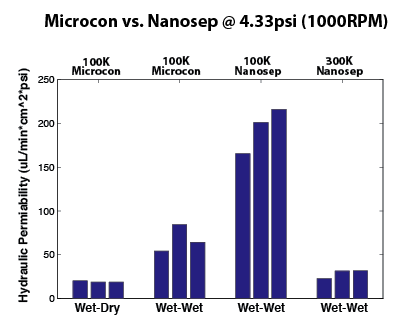
Looks like more good reasons to skip the comparisons between microcons and nanoseps for the purposes of the paper we need to write.
This is complicated and sorting it out will likely require complete permeability vs. pressure curves for each device.
It seems to me that for sake of scientific clarity, we should try to pressurize these things. Applying a constant pressure for set periods of time seems like quite a reasonable experiment that could quickly provide useful characterization of membranes. Using the centrifuge, we are doing a nonlinear sweep of pressure over time, and I don’t fully understand why introducing such a dynamic situation offers any advantage. Of course, it’s good product information and I like it, but if we really want to understand membranes, experiments that mimic our air-flow experiments would provide a clearer picture.
Actually, I still have no idea how a permeability is extracted from these experiments – is the process posted somewhere? You must take 3-5 time points and extrapolate a flow rate function of time? Then you likely map this to a temporal function of pressure? Then, since we know that the permeability varies with pressure, there must be some type of correction function to account for this? Then a permeability number pops out? As long as several people have checked the numbers, I’m OK with it, but a short tutorial on the data analysis would be helpful.
Also – is the permeability for the 300k nanoseps from 3/13 correct? Since the other devices seem to be consistent, but the 300k nanosep permeability plummets, it’s difficult to reconcile, if pressure is the only difference…