Adsorption Quantification V
This week I went back and took a look at this figure. In the previous incarnation, when prewetted, PES dropped down in adsorption much less than cellulose. I decided to retry this sample and keep in mind some of the things we have learned since then. I was careful to expose both sides of the membrane fully to the buffer and protein. This is something I may not have done earlier, but is necessary considering the differences in the sides. I tried to shake off as much of the buffer clinging to the membrane after the rinse as possible too.
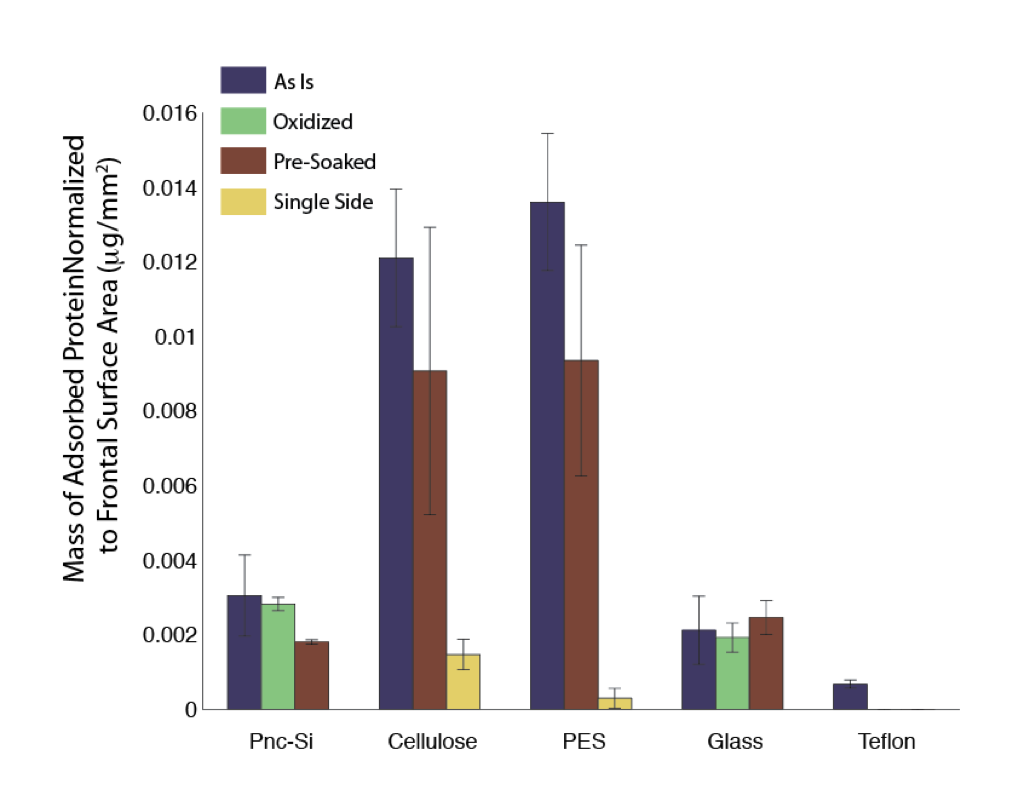
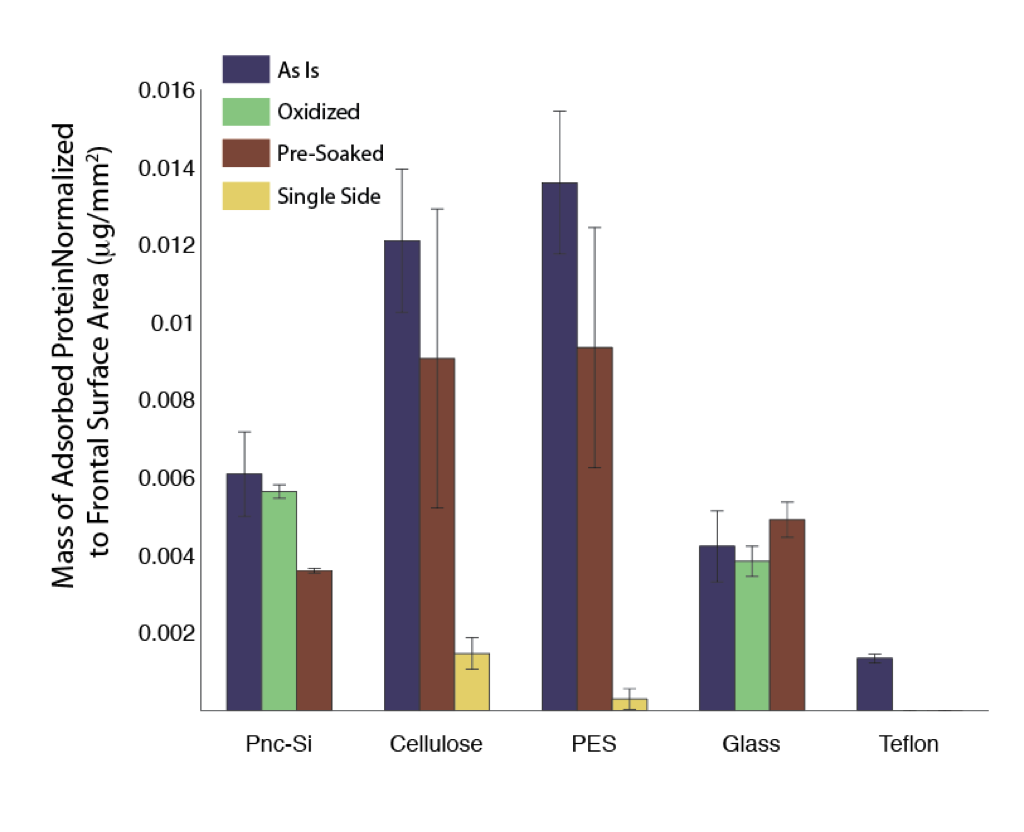
The new figure (above) shows PES and Cellulose to be quite similar. The single side of pnc-Si and glass are lower than double sided PES and Cellulose. The following figure shows a correction for this (I really just multiplied the glass and pnc-Si values by 2 to represent two sides.
I’m still confused about why the binding is higher to the polymers if the protein is too large to access the interior at least the case of cellulose which I thought was asymmetric. Do you have a good explanation or should we add some experiments with cytochrome C?
We talked about using BSA as a probe protein. Yes, it probably wouldn’t get across the membrane in an actual application, but in this case we’re just trying to illustrate the potential for adsorption.