Using JMP7 for Membrane Reliability and Performance
JMP7 statistical software was used to perform a Tukey-Kramer analysis on both burst pressure (psi) and air permeability for membranes fabricated on 200um and 400um wafers. This data has been collected from a spreadsheet that is maintained by Karl and Maryna. The following plots are only examples since there are several other conditions that may be considered when grouping the data, but the results are certainly not insignificant.
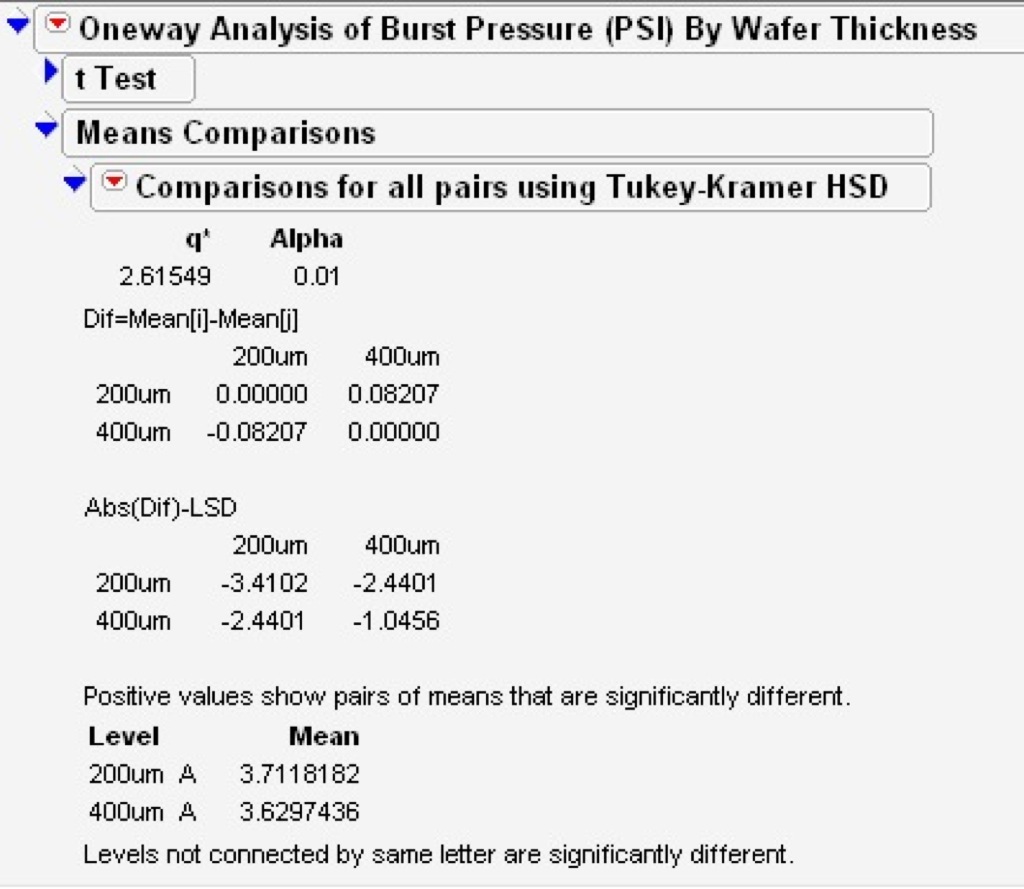
Tukey-Kramer can be used to test for differences among two (or more) independent groups. For the following case, I wanted to see whether there was a significant difference in burst pressure when comparing membranes fabricated on 200um and 400um wafers:
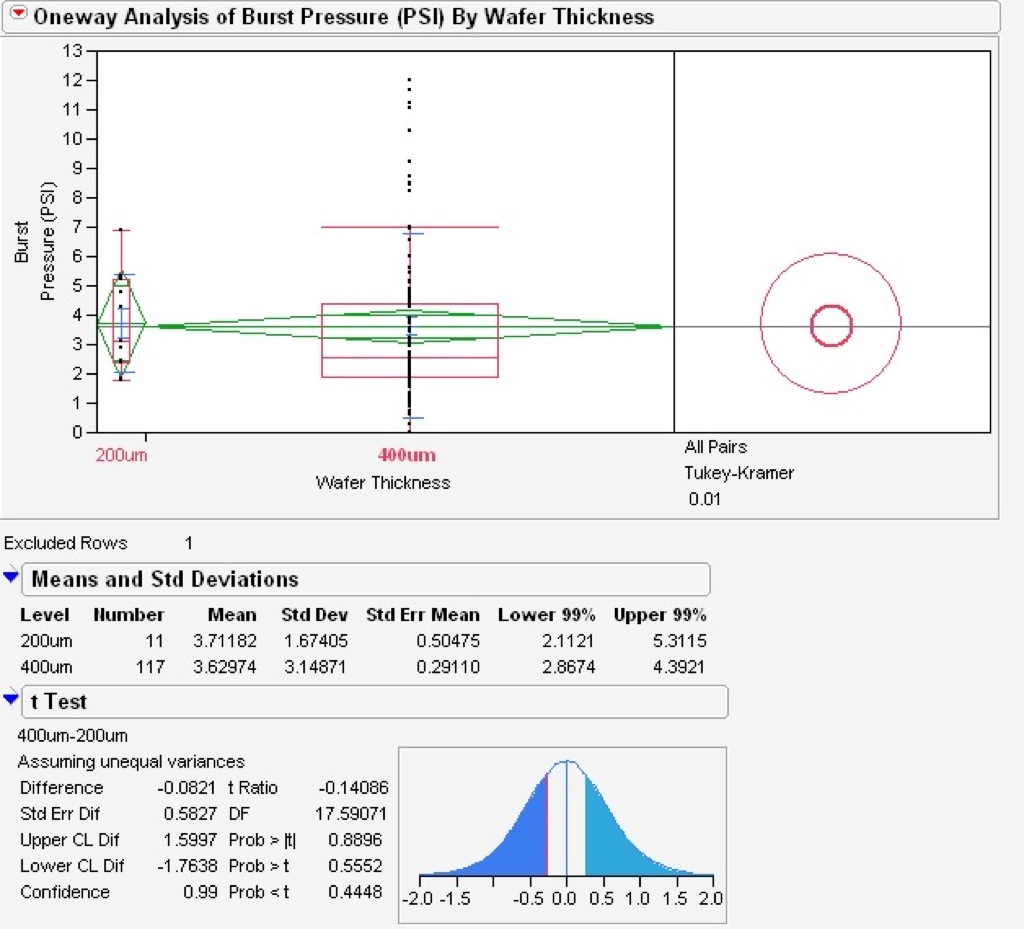
The data plot is to the left. To the right is the Tukey-Kramer analysis. Area of the circles are inversely proportional to the sample size. The more one sample size is centered on the other, the more similar the data is. From this plot, the conclusion would be that there is no difference in burst pressure when using a 200um wafer as opposed to a 400um (although I realize there are not enough data points for 200um wafers to draw definite conclusions). A t-test has been added so the data distribution can be observed. Further statistical results for burst pressure are shown below:
I conducted another Tukey-Kramer analysis on the air permeability data from membranes fabricated on both 200um and 400um wafers. The results are shown below:
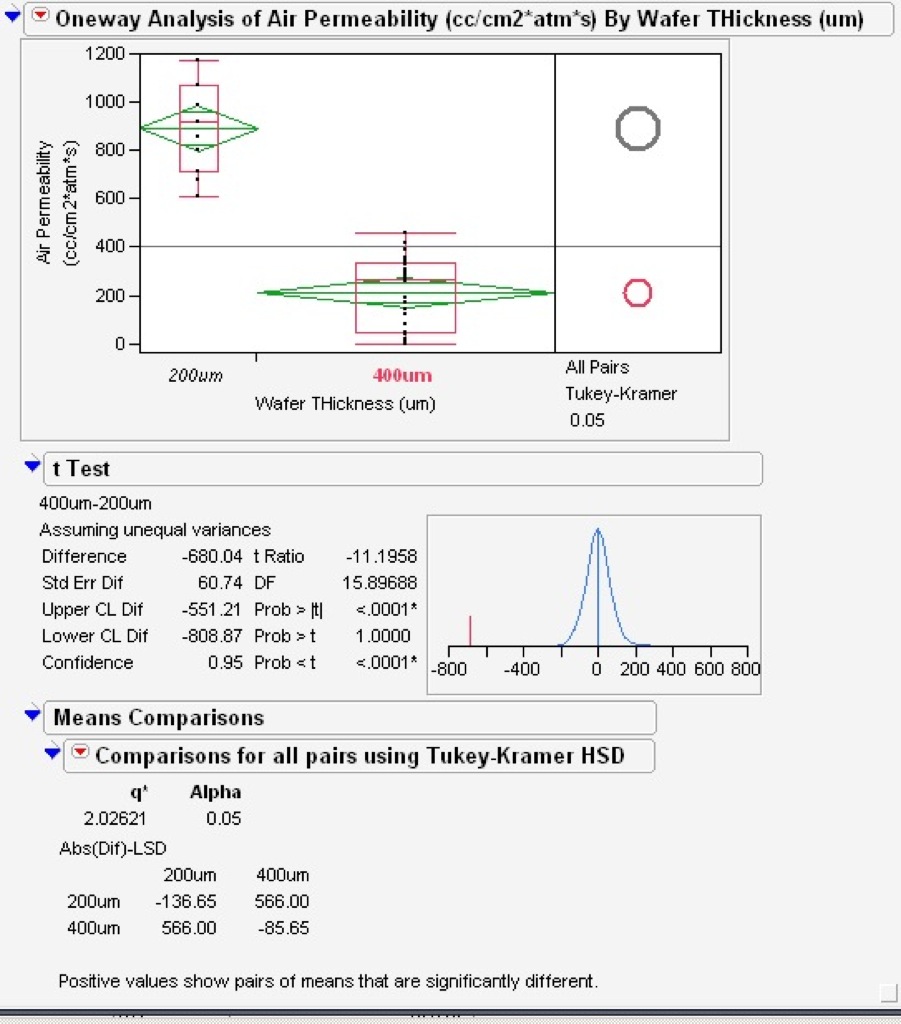
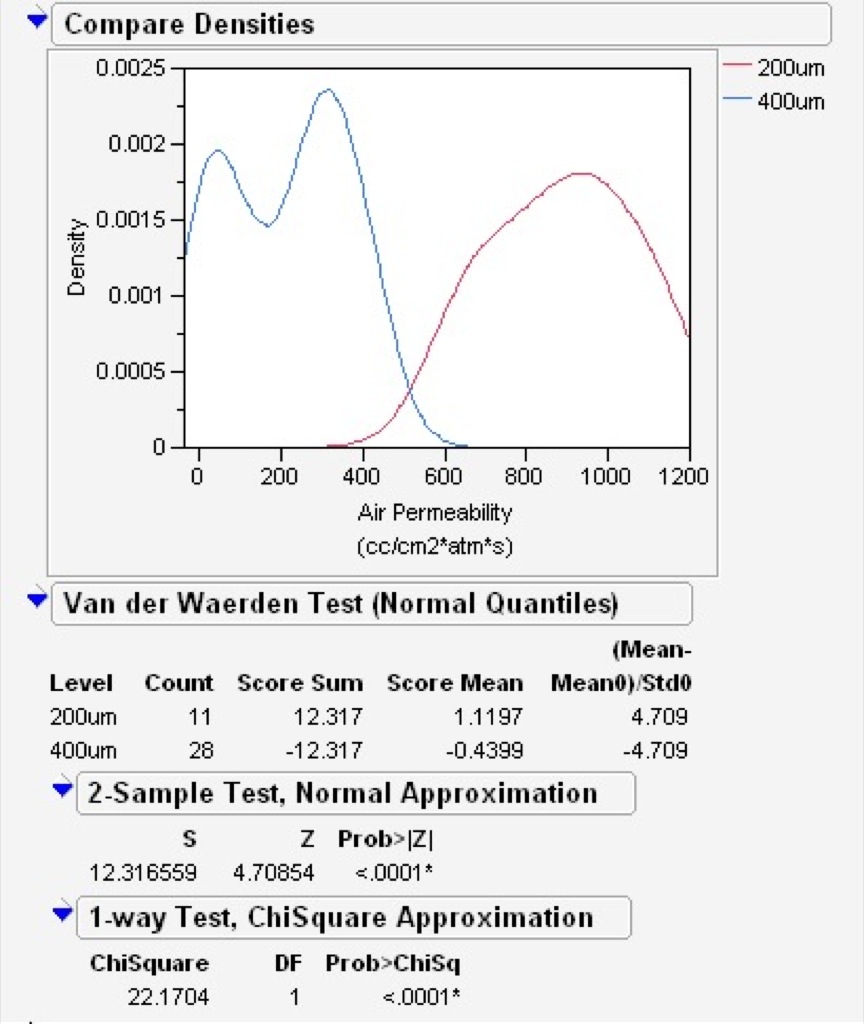
Interestingly, the data shows that there IS a difference in air permeability between 200um and 400um membranes. This is obvious when observing how “misaligned” the two sample spaces (circles) are. This result can be confirmed by looking at the t-test distribution chart and statistical data (data density) shown below:
I have posted this data to show that a program has been developed to automatically group and plot data using JMP7. The program is especially powerful when there is a need to find statistical differences between independent data sets. The program can also be used in exporting data from tool sets (such as the Veeco Wyco) and automatically update the charts in JMP. As we look forward into mass production, we should consider using this tool for reliability statistics and finding process anomaly’s.