Effect of PES Cutoff on "Electro-osmosis" Rate
We have two cutoffs for the Millipore Biomax PES membranes: 50kD and 30kD. I tested the “EO” rates for both of these membranes and plotted them in this figure with standard deviations (3 trials of 50kD and 4 of 30kD).
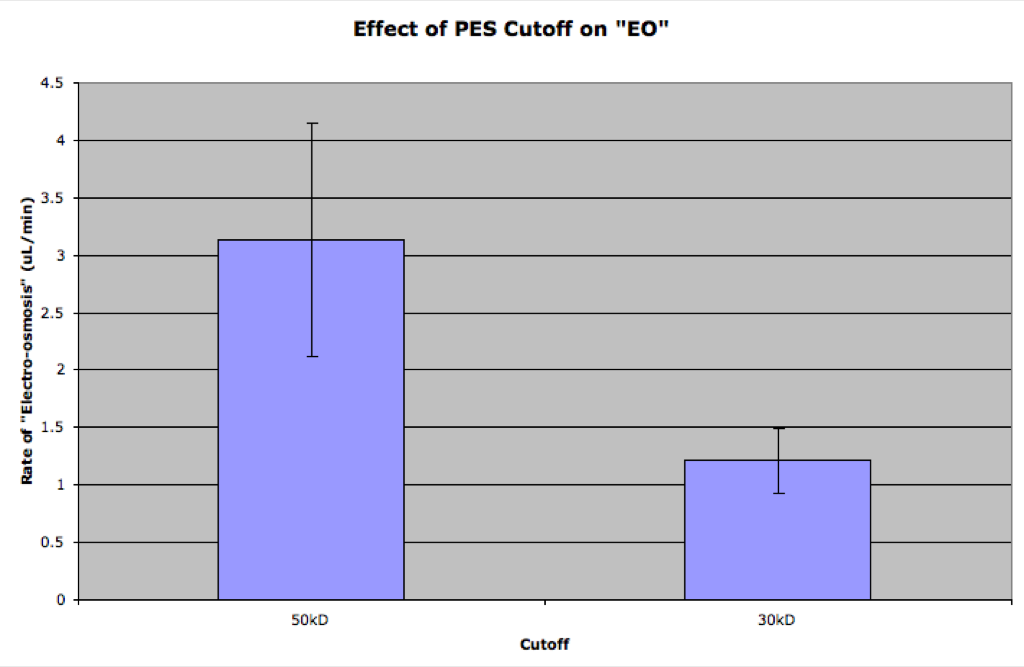
50kD has a significantly higher rate of “electro-osmosis.” I will try to compare these rates to those found in the literature.
How does this compare to pressure driven flow rates for these membranes? I’m curious about whether there is a bigger EO push, or just less resistance. This difference is interesting though, so the similarity in PES and cellulose flow rates may just be a coincidence, or related to cutoff….
Here’s a rough calculation:
In pressurized flow our membranes are on the order of hundreds of ul/(min*cm2*psi) and PES membranes are tens of ul/(min*cm2*psi) at same pressure.
My EO data shows pnc-Si are about 7 ul/min. If we normalize that to active area (.004cm2), we have 1750 ul/(min*cm2).
For the PES the 50kD value in this post is 3 ul/min. The active area of PES (when you remove anything blocked by the o-ring) is about .43cm2. Normalizing 3ul/min with this gives you 5.17 ul/(min*cm2).
This is a huge difference! In fact EO seems to give us an extremely high rate of transport even when compared to pressurized flow. The next thing for me to check is probably the relationship between driving voltage and EO rate.
Correction:
For PES diameter is .43cm, area is .145cm2, and flow rate is 20.7 ul/(min*cm2).