Hydraulic permeability in the pressure cell
I’ve recently been exploring hydraulic permeability using the pressure cell. As you may recall, the majority of our permeability measurements have been done in the centrifuge (EQ format or closed bucket). The pressure cell allows for a more accurate measurement of permeability because it is not affected by changing water levels or variable driving pressures.
I first assemble the square chips inside an open bottomed SepCon vial with a PDMS seal. I then soak the top and bottom of the chip with ethanol (%70) for at least 20 minutes. The thought is that the ethanol has a lower surface tension and will wet the pores more easily than water. I then pipette out the ethanol from the vial and introduce water. I displace the ethanol on the bottom (membrane side) with 40 uL of water, just enough to wet the entire front surface of the chip. I then assemble the pressure cell and run it at 3-5 PSI for 10-20 minutes. I collect all the water with an eppendorf tube.
Here is the chart showing the permeability for a number of membranes of different porosity. A fresh sample was used for each measurement.
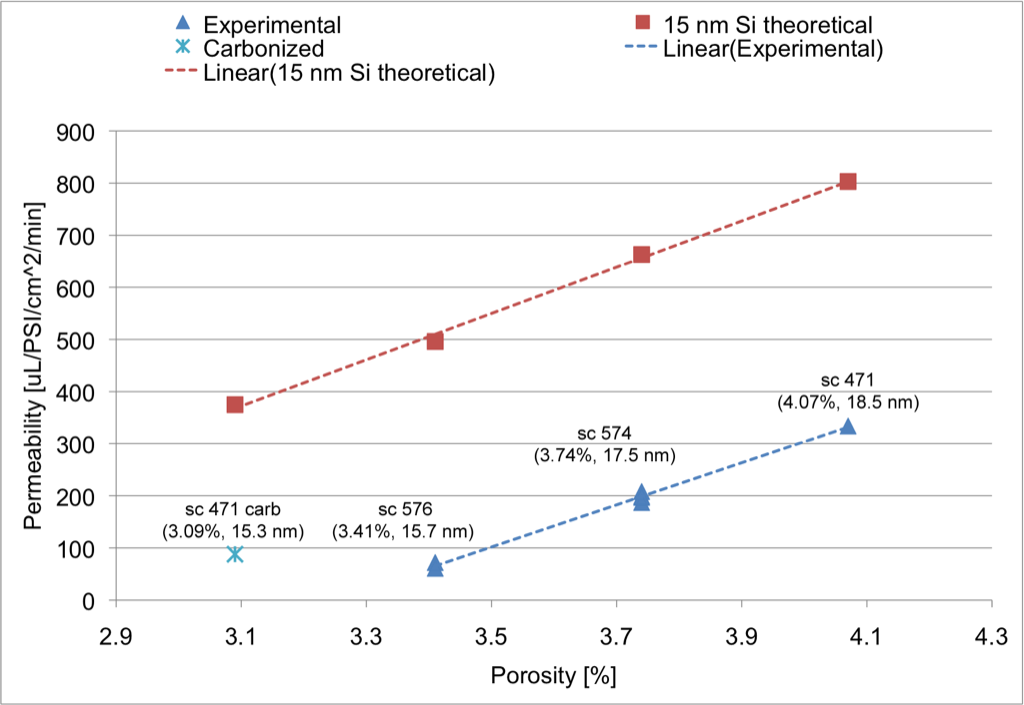
The theoretical points are calculated from the actual pore histograms and the Tong equation. Some notes:
- I am plotting the permeability vs. porosity, but we should keep in mind that permeability is dependent on the pore size distribution as well. With this in mind, it is interesting that the membranes with different porosity fall along the same permeability line.
- All measured permeabilities are 3x below the predicted
- If we believe that the carbonized sample is similar enough in distribution to the rest, there is an enhancement in flow
- The question still remains as to why the measured values are so much lower than predicted. Some thoughts:
- Charge effects along the wall; I am using DI water for these experiments. Could electrostatic interactions be creating a larger resistance effect than Tong/Dagan predicts? Next, I plan on testing permeability with PBS to limit the electrostatic effects.
- Clogging; although I am using a fresh sample for each data point, clogging may still be a factor (see below).
- Entrance/exit effects; since our pores look more like “discs” than pipes, could entrance/exit effects dominate permeability?
I was also interested in exploring permeability through the same membrane at different pressures. Ideally, we would see no change in each of the trials. I started with one fresh sample and one used sample that had water pushed through at 5 PSI before the experiment. The numbers next to each point represent the order in which the trials were performed.
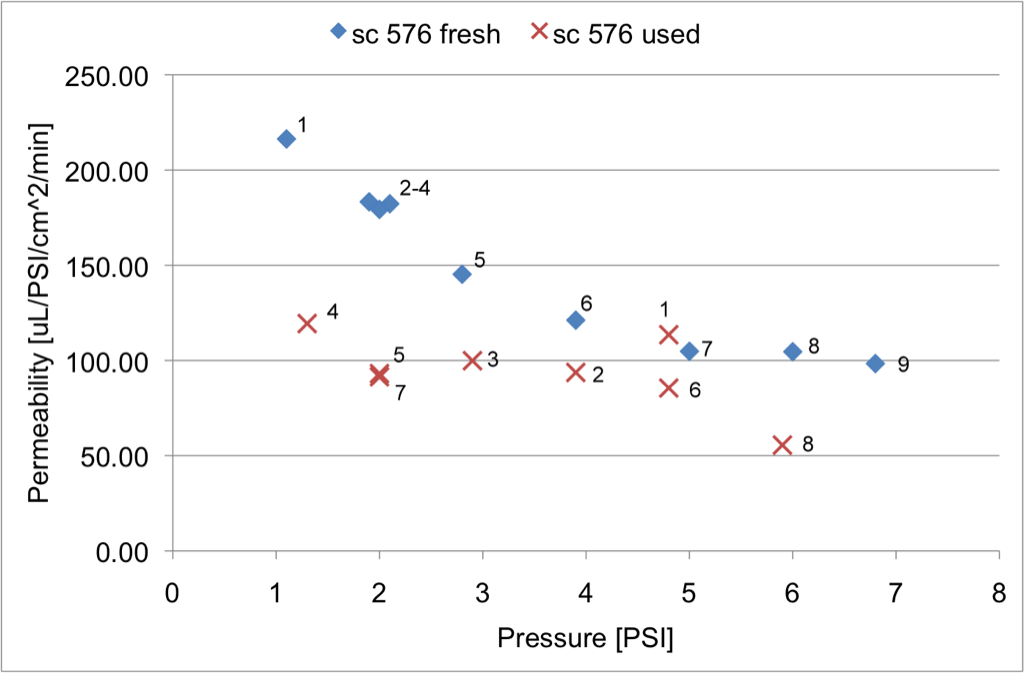
The decrease in permeability with pressure in the fresh sample points to a clogging effect. This is supported by the low permeability observed in the used sample which was first tested at a high pressure. I am using the DI water from the flat Nalgene tank next to the Barnstead system, but I may start pre-filtering the water before my next tests or start using water from Hopeman.
I did a quick calculation to check your theoretical permeability, and came very close to your numbers, so everything appears to be correct.
The Tong paper does a quick check for kinetic losses due to entrance/exit effects and concluded that they are negligible (of course they could be wrong, but they have a good reputation in this area). Tong does openly admit that electroviscous effects due to the debye layer are completely ignored and openly admit that this could create substantial error in their theory. They cite reference 23 and 24, which we may want to look at.
I’m curious to see what happens when you try a buffer solution with relatively high salt. If electroviscous effects are important, you should see a substantial difference. It’s good that your error appears to be quite small, so differences should be obvious.
In future experiments, if you could randomize the order in which the various pressures are run, or re-run the initial pressure value, it would help evaluate the effect of clogging. The water system in Hopeman has a 0.2 um final filter (not sure what Jim’s system has or how often the final filter is changed), but it may still be a good idea to run a small volume of water through a 0.1 or 0.05 um filter in the lab, if you confirm that clogging is an issue. There are a number of disposable filter products that can be used. You could also throw one of your used pnc-Si membranes into the SEM to see what has been collected.
How steady is the flow in the pressure cell? If you don’t know, it might be worth checking. Tom has described delayed flows in this set-up and so which method is really more accurate? Yes there are the time dependent changes in the centrifuge set-up but the flow is reliable and the time dependence seems to be captured by our equations.