Barcikowski Particles
The Barcikowski samples, sent from Germany a month ago, continue to be a fecund source of inconsistant data. Using the DLS to monitor several filtrations has resulted in a series of baffling results that I think I’ve finally begun to understand.
First, the promising results:
A DLS of Sample 1 (a mixture of bioconjugated gold and unconjugated ligand) straight out of the bottle measures a number size curve with a peak at 24.2nm. Placing this into a 20nm Sepcon and spinning at 2000rpm for 5 minutes yields a filtrate with an average size of 11.9nm. This is good.
Repeating this experiment, fresh Sample 1 gave a number size curve that looks like this: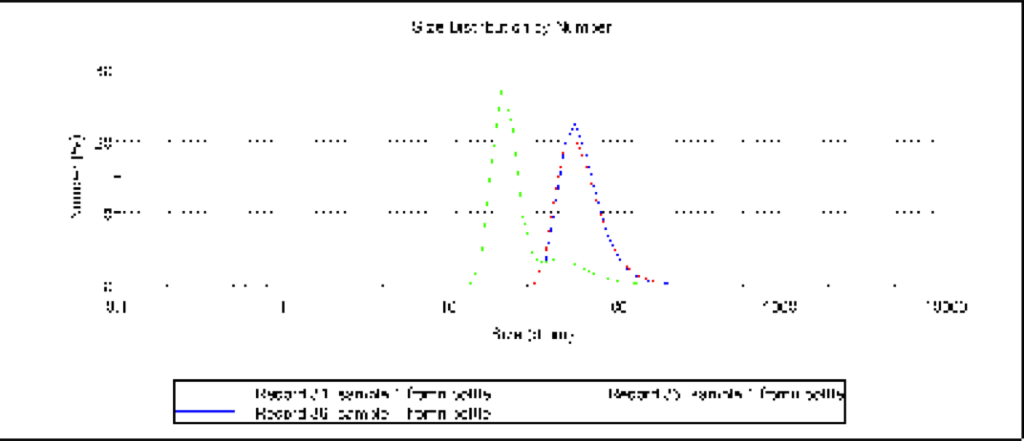
Where the average size is 67nm, but the smallest peak is at 21nm. After spinning in a Sepcon the filtrate has an average size of 10.1nm.
Similarly, a DLS of polydisperse platinum (4-40nm) straight out of the bottle peaks at 20.6nm. Placing this into a Sepcon and spinning at 2000rpm for 5 minutes yields a filtrate with an average size of 8.58nm. This is also good, even if the cutoff the lab wants is <5nm.
But when I repeated this experiment on Friday, though the platinum from the bottle measured 14.6, over three different measurements I was unable to measure anything in the filtrate less than 62nm.
Throughout these experiments, I’ve been plagued with DLS measurements giving me particle sizes an order of magnitude greater than what I was looking for. I’ve come to the conclusion that there is actually two different phenomenon at work here (and thanks to Jess Snyder for pointing me in the right direction). In the unfiltered samples, a small number of larger aggregates are distorting the results that the DLS is giving me (excepting platinum, the one sample where we never see aggregates), whereas the filtered samples all contain gold (or platinum) at such low concentrations that the DLS is as likely to pick up dust as it is to measure the gold. Indeed, I’ve used the TECAN to measure the concentrations of all of the samples after they’ve been filtered in the 20nm sepcons, and all of those measurements were too small to be accurately read. The combination of a little aggregation in the unfiltered and low concentration in the filtrate explains why I’ve seen the size of Sample 2 (another mixture of bioconjugated gold and unconjugated ligand, with a slightly higher concentration of ligand than Sample 1) go from 66.1nm to 50.9nm after filtering through 20nm cutoff Sepcons, or why I once measured filtered platinum (normally 8nm in diameter) to be 97nm.
I tried to measure the size of the filtrate of separations performed with both 15nm and 10nm cutoff Sepcons, but I got (predictably, with the benefit of hindsight) nonsense measurements because of the even lower concentrations of gold.
What this all means is that the DLS and the TECAN won’t be much help in examining these separations, because the concentration is just too low for the data to be reliably distinguished from noise. Instead, it looks like I’ll have to use the TEM and the SEM to characterize the separations. The good news is that our filters are working, and seem to be working in the way that the Barcikowski wants. As long as they are fine with very, very low concentration of their desired metals, I think we’ll shortly have what they’re looking for.
Can we see before and after spectra for these separations?
If the concentrations are really that low: 1) its unlikely that its useful to the Barcikowski group, and 2) you are going to have a hard time finding the particles via EM. The Barcikowski group is going to be interested in yield = the fraction of starting sample that we can recover in pure form.
Where are the particles going? Its likely that they are being retained. But yet the membrane isn’t clogged, right? Is the flow rate slowing down over time? If not, you should try a slower flow rate to see if the yield goes up if you proceed slower. The speed of the process is not as important as the yield and the purity of the product.