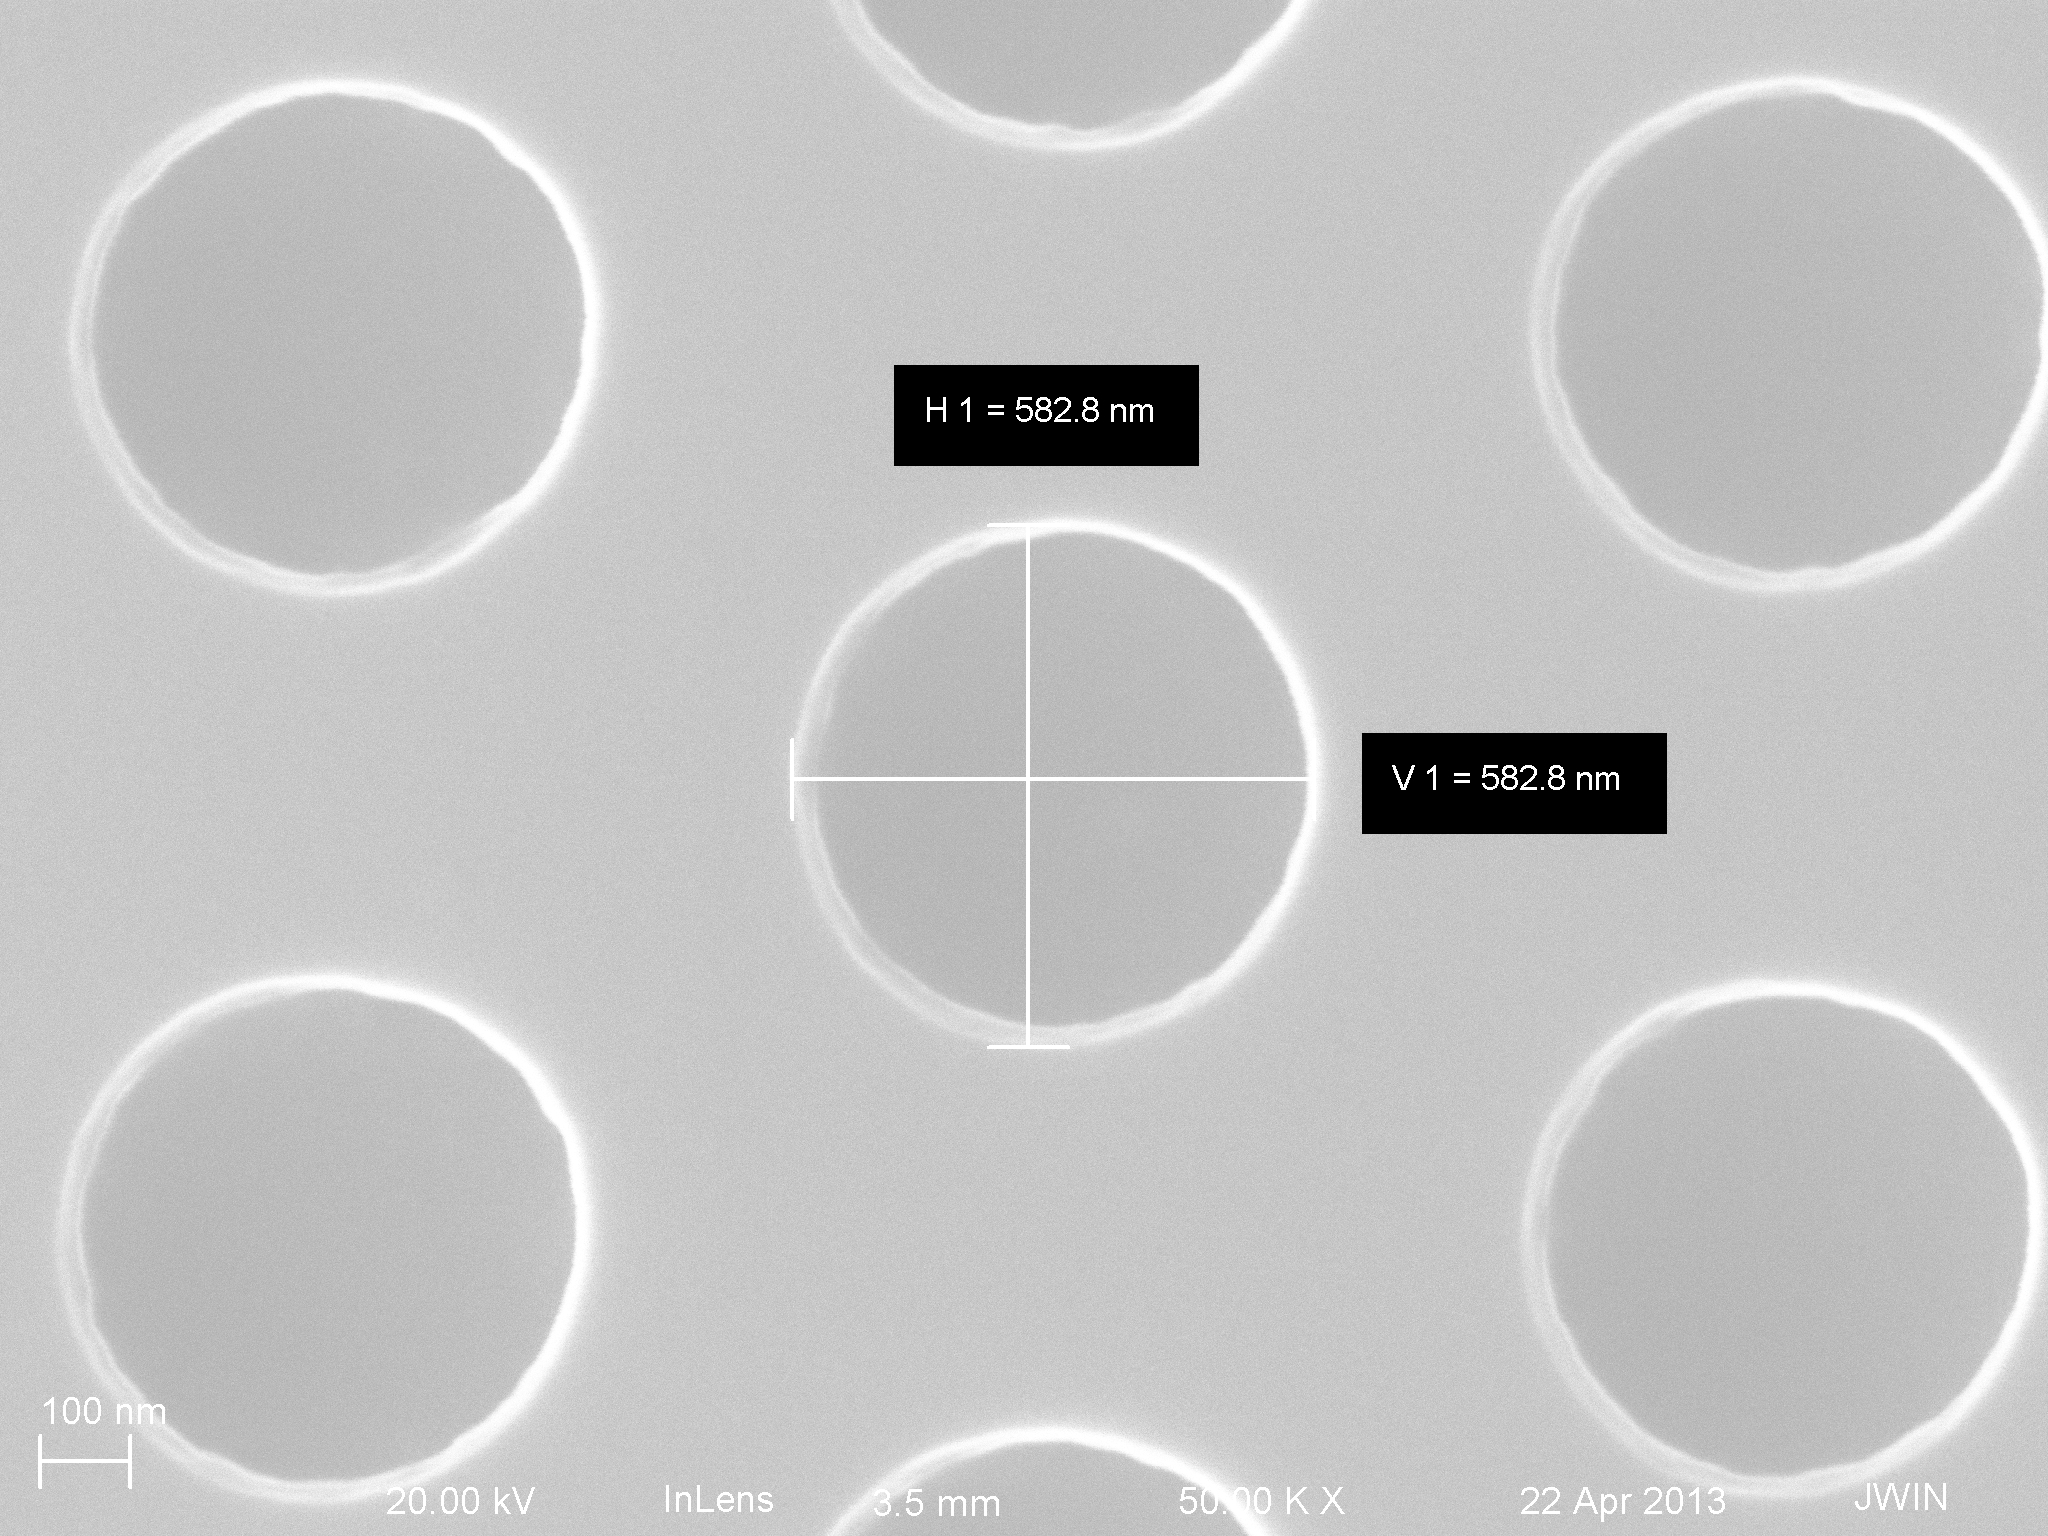
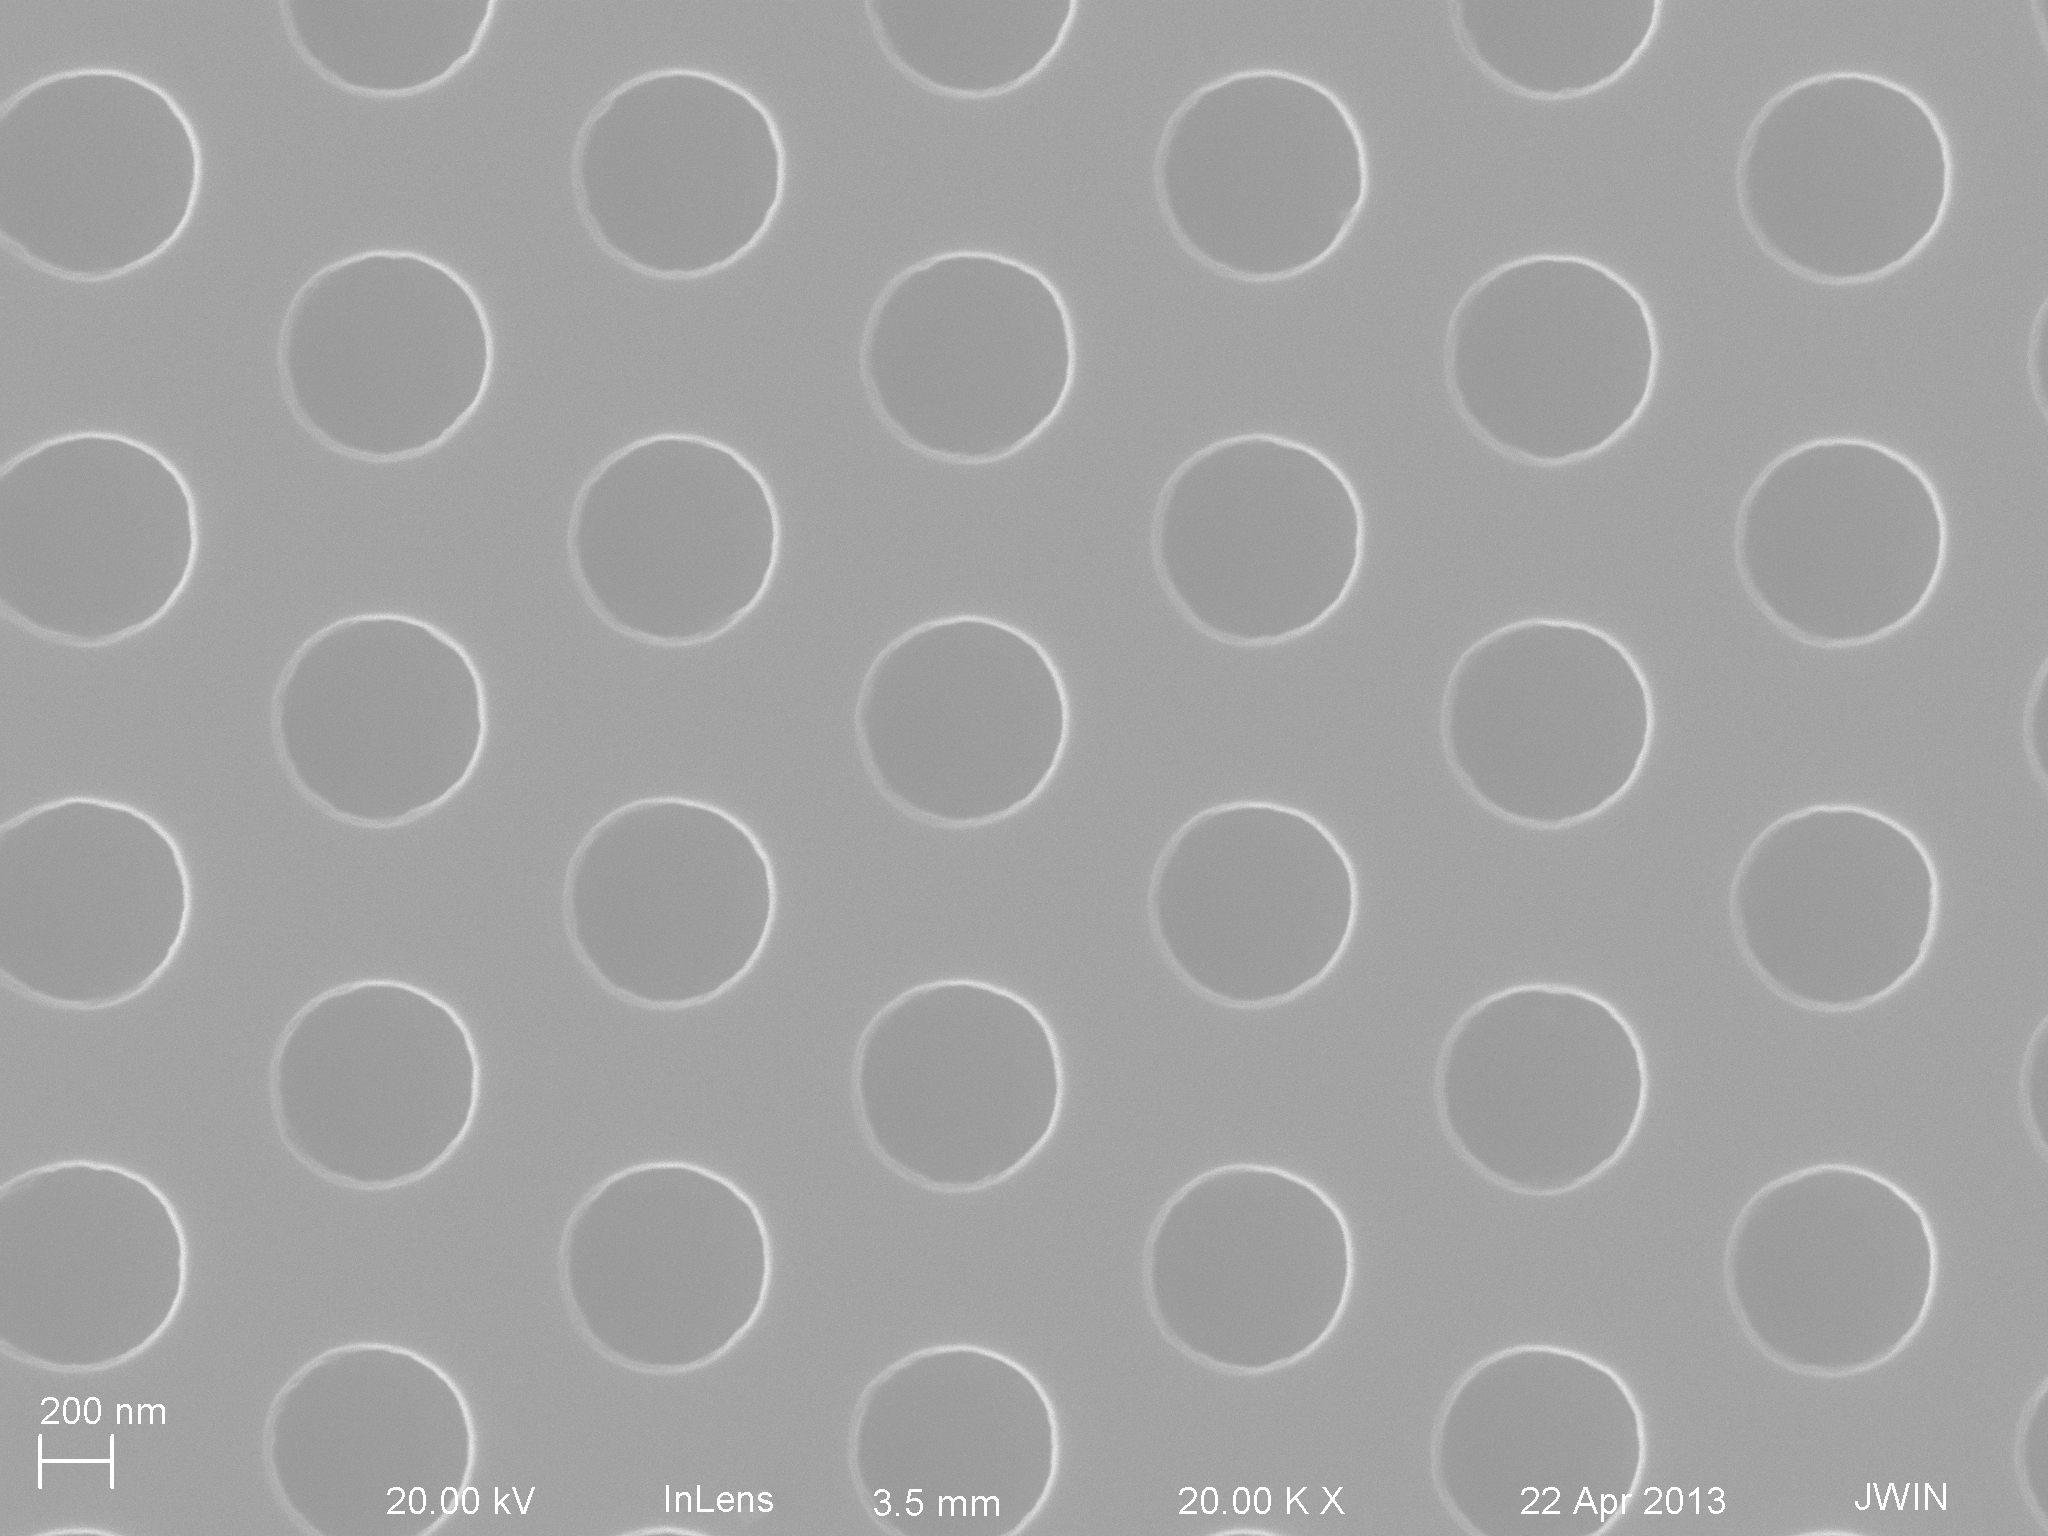
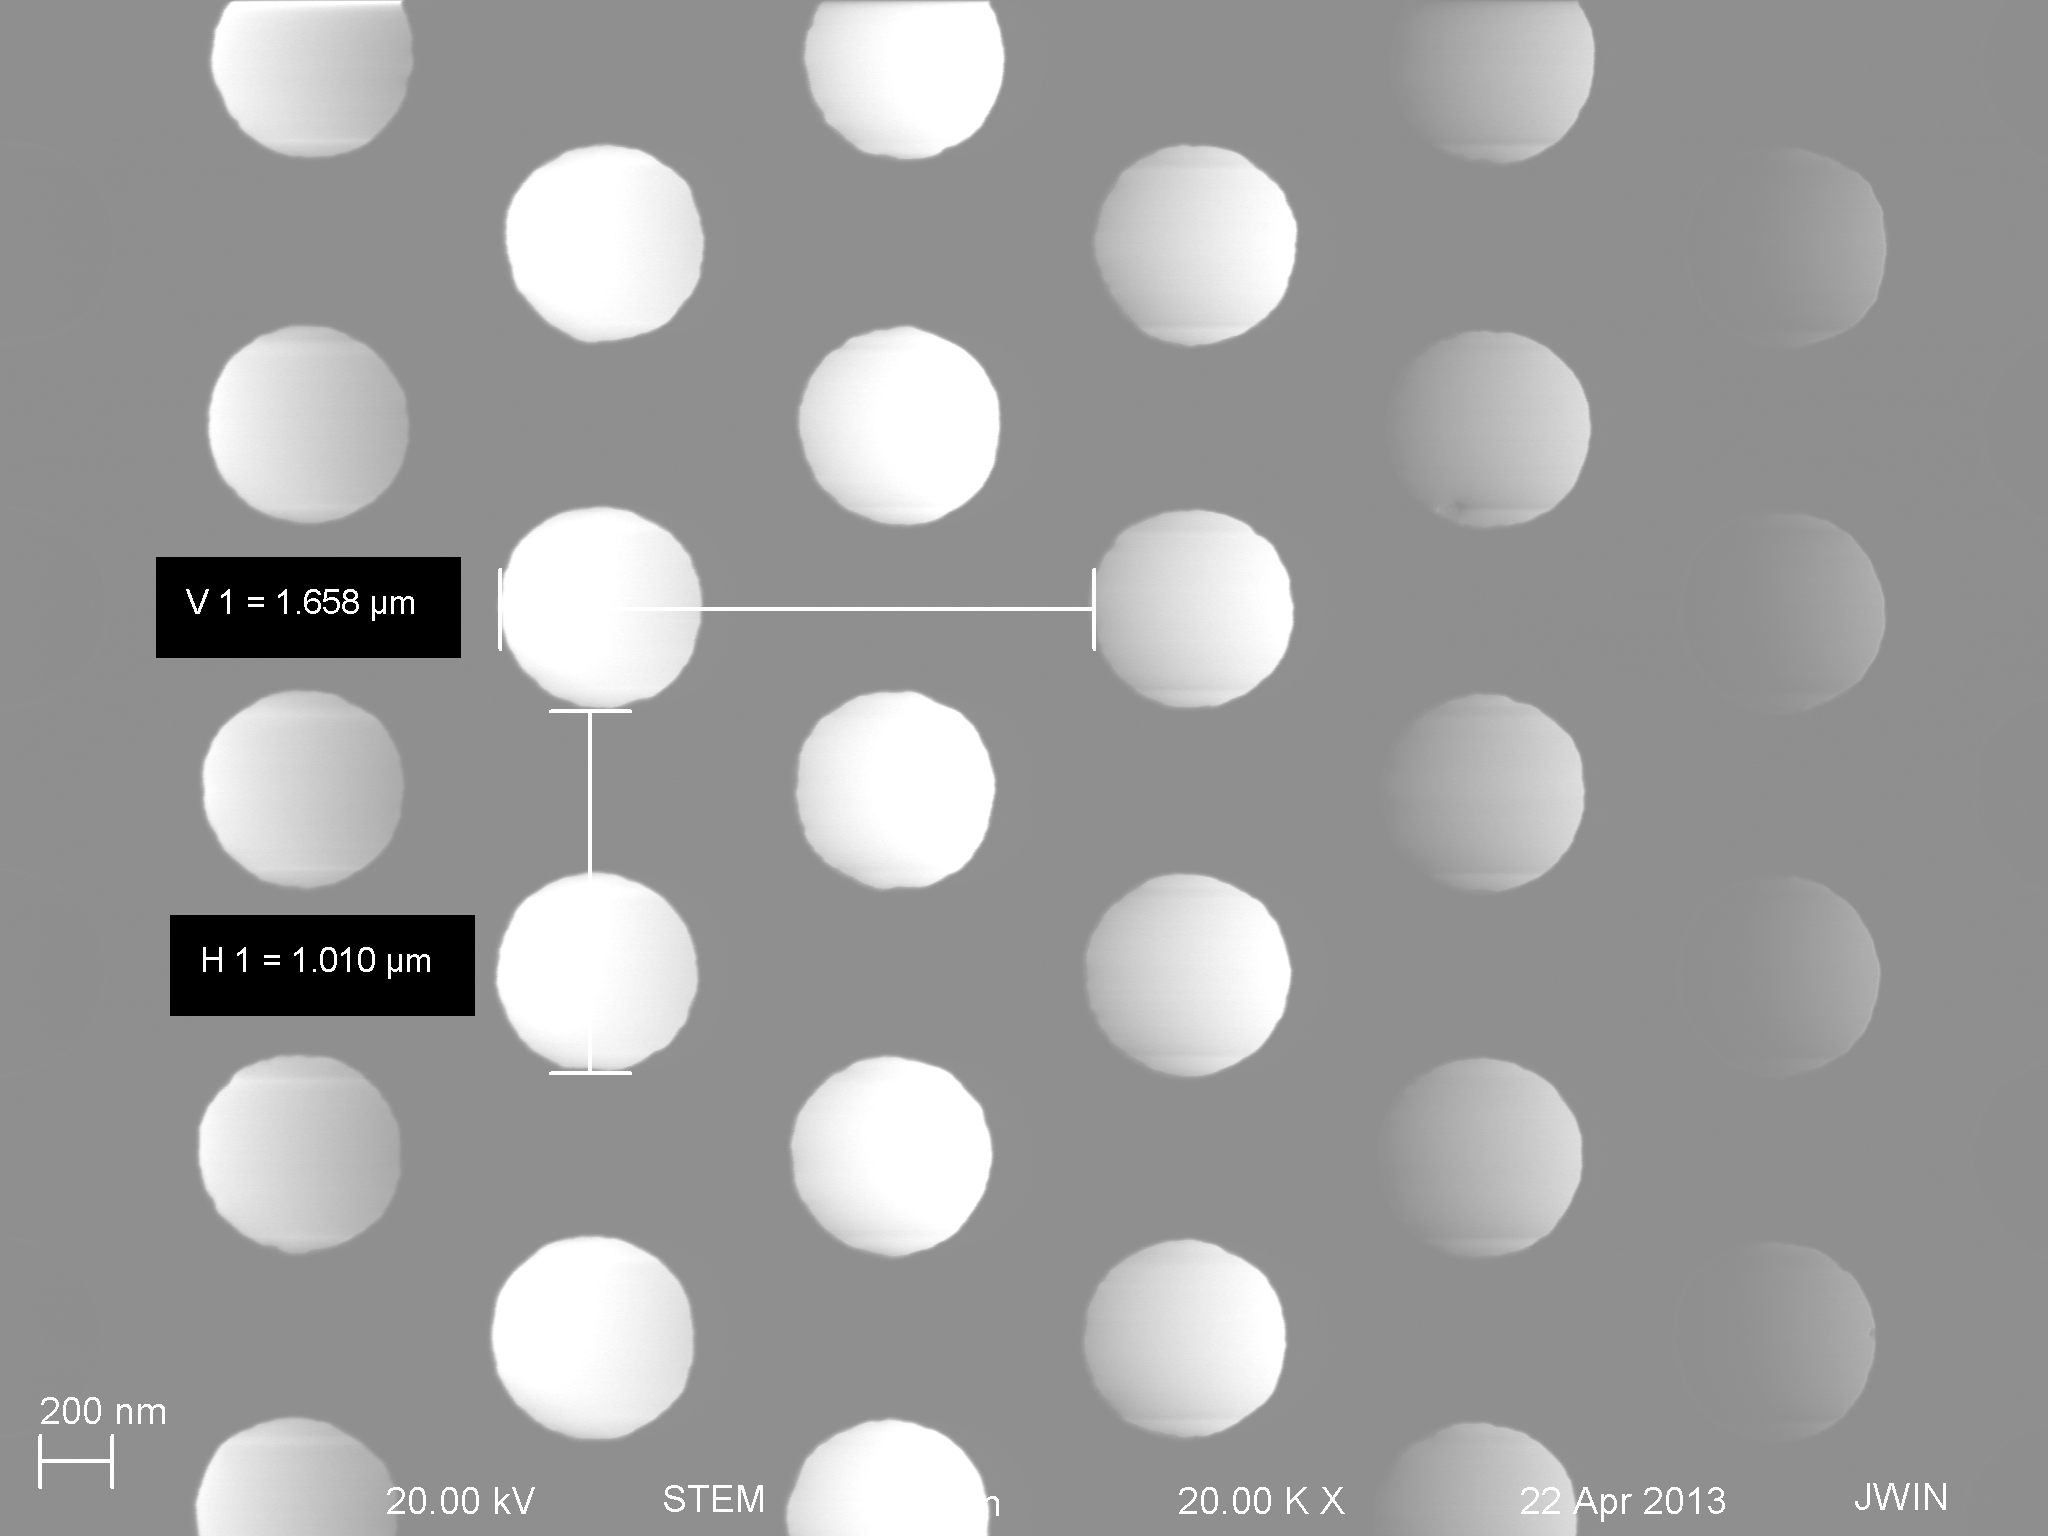
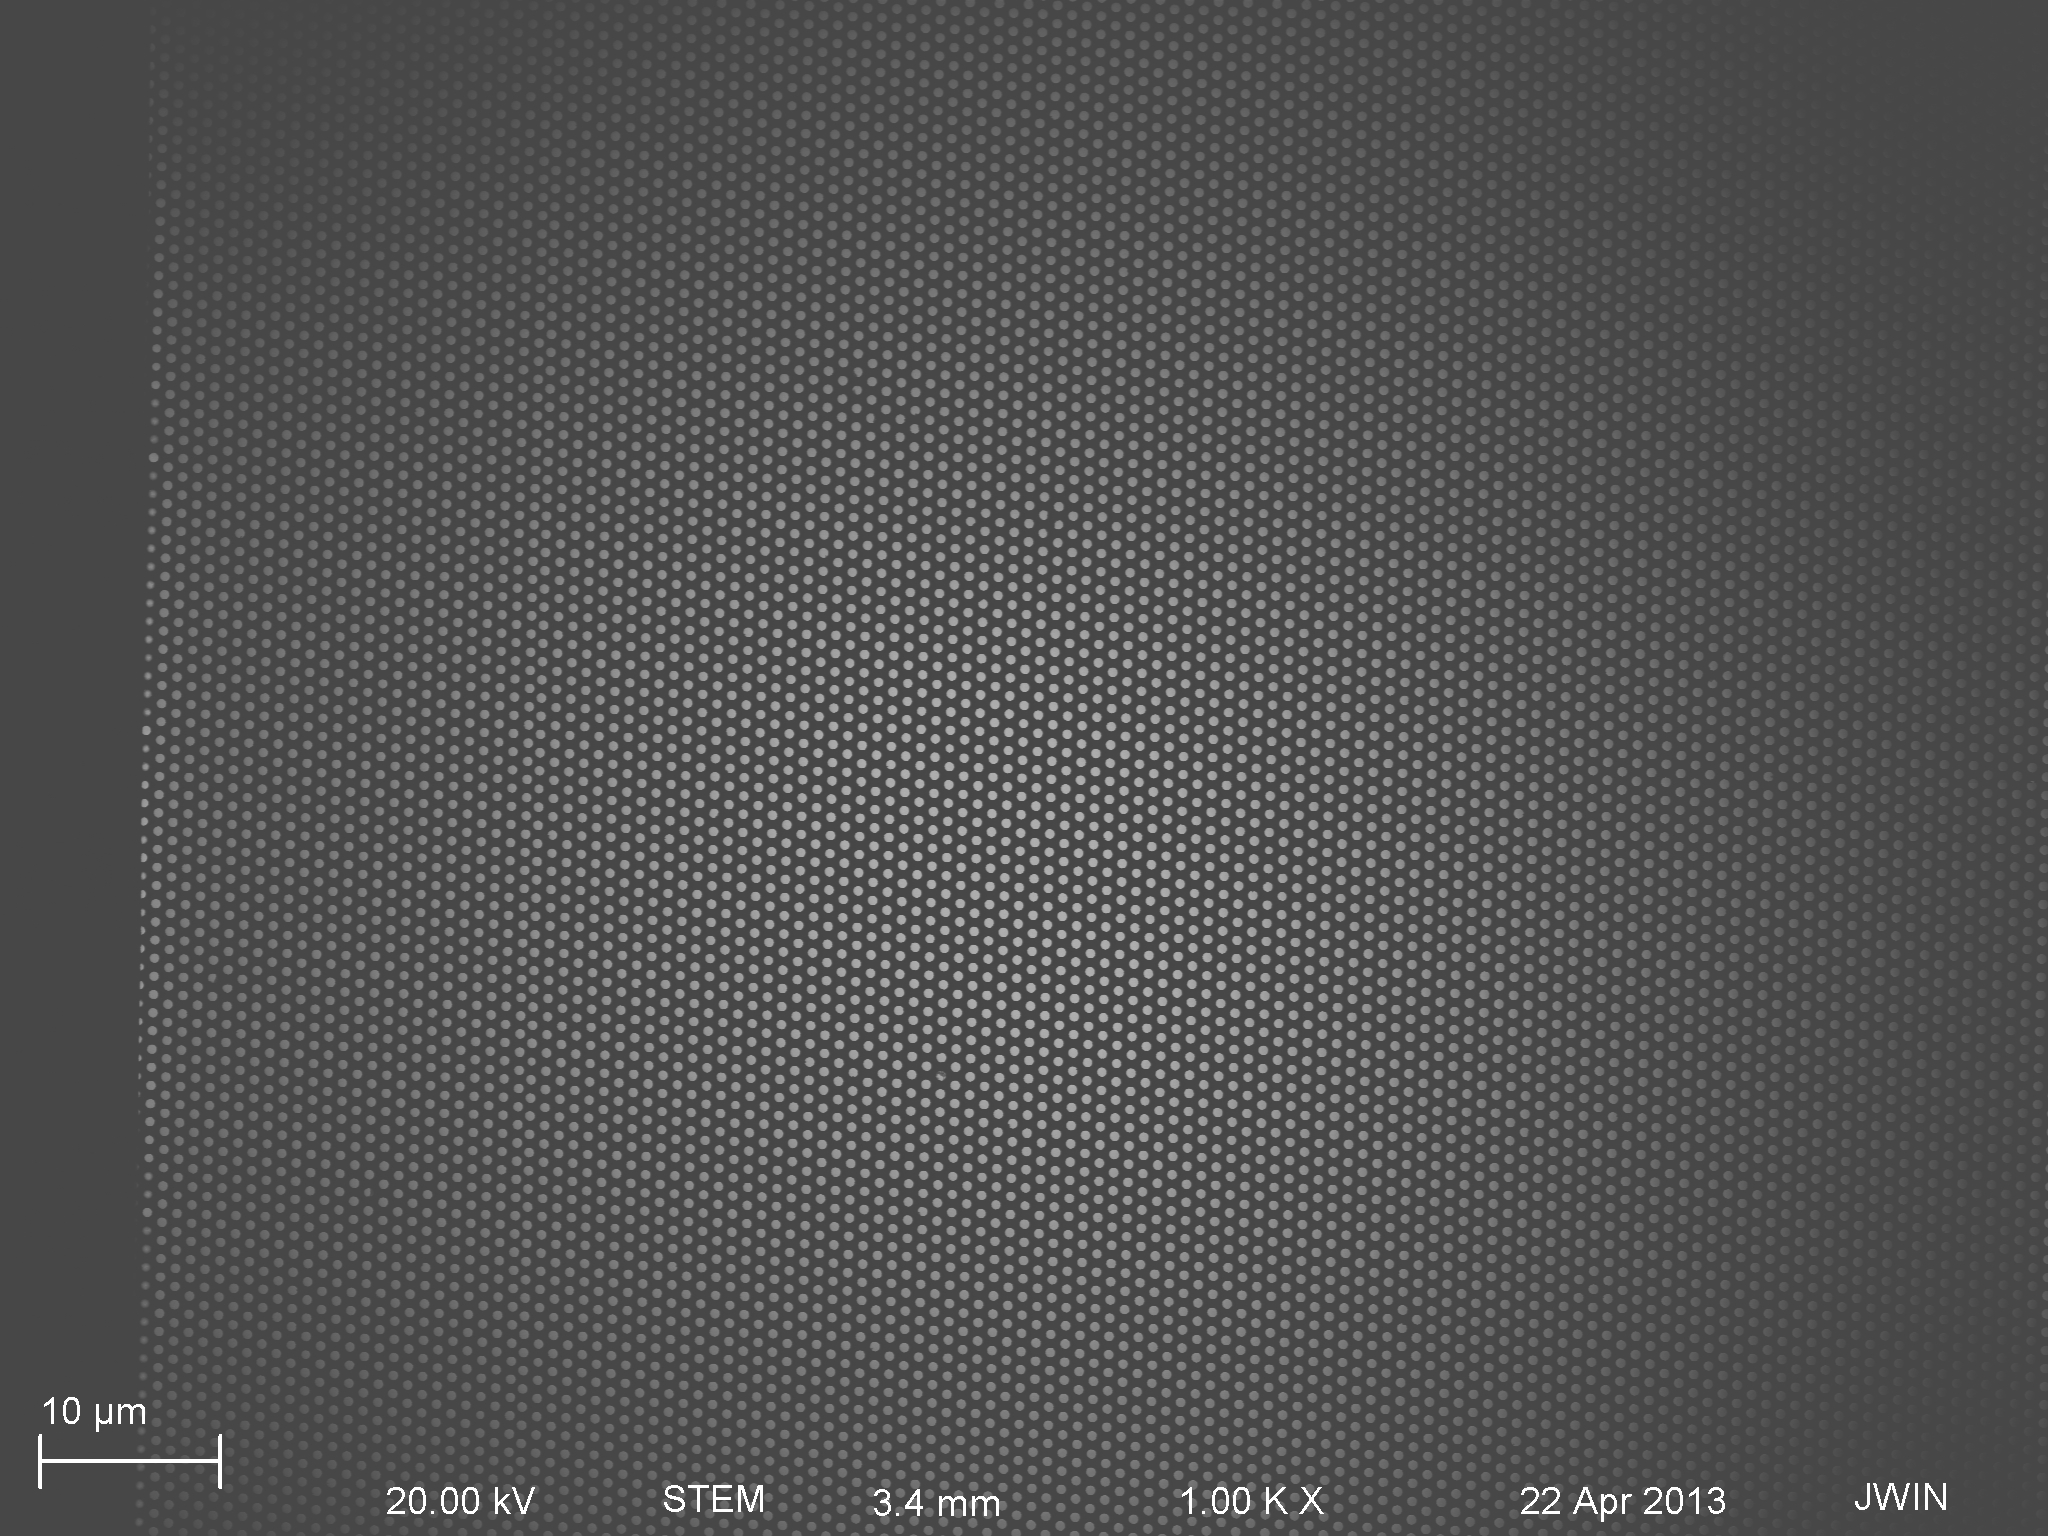
550-600 nm diameter pores in 120 nm thick SiN
Wafer # 4369 (PFI 02) was fabricated with pore sizes ranging from ~550 – 600 nm. Below are two SEM images of the pores, followed by two STEM images. The pores are all open and very well defined. The only defect I could find was a slight stitching offset in the patterning as seen the the fourth image below. All in all, terrific.
The wafer is 5 slot SEPCONs. Karl and I have been working on testing the membranes. Let me start by saying that I have a lot to learn about proper use of the Malvern and Tecan. We will only post the fluorescence data we acquired with the Tecan with the hopes of backing it up with DLS data later on.
So, to test fluorescence, we excite the particles with one wavelength (excitation wavelength) of light and measure the emission wavelength which is usually 10 or more nm higher in wavelength. Below is a simple picture showing the concept of this test. (We don’t actually measure the fluorescence in the SEPCON assembly. Instead, we collect 3 uL of the sample of interest and place that on the Nanoquant plate.)
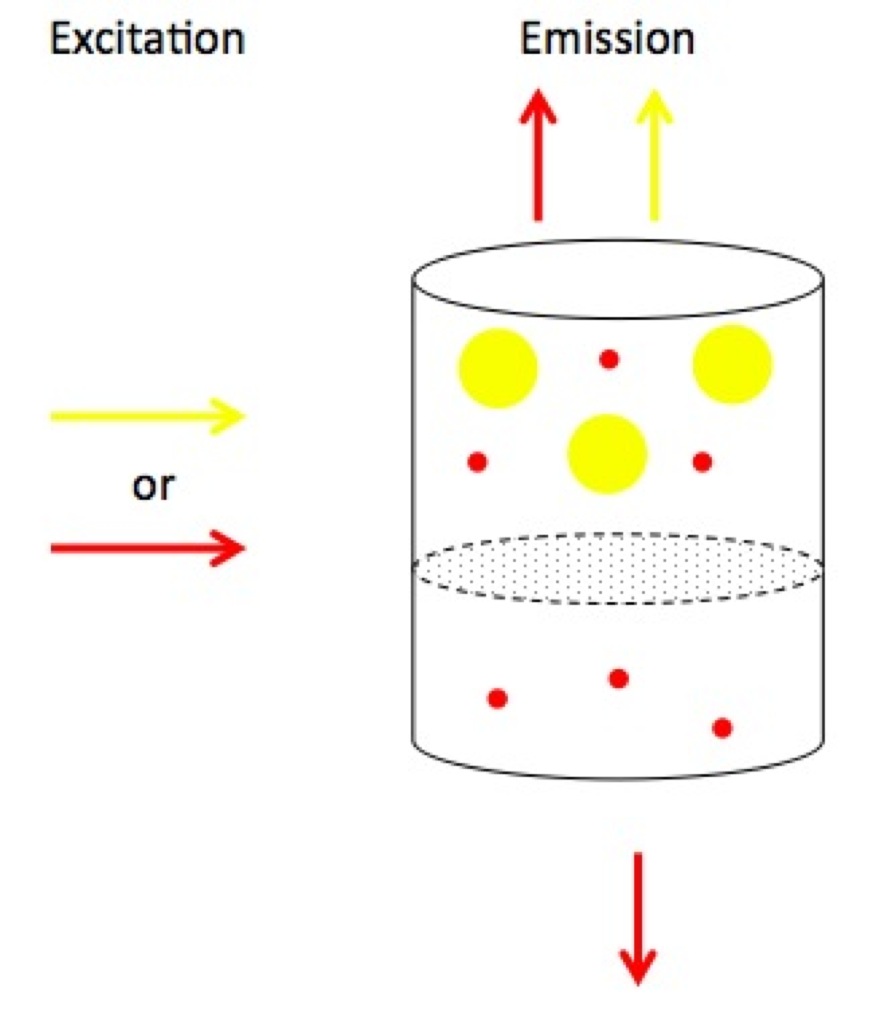
We used two particles size in this test. 500 nm and 20 nm. The 500 nm samples had Ex=505 nm and Em=515 nm. The 20 nm particles use Ex=580 nm and Em=595 nm. The hope is that we put a mixture of both particles in the top and collect only the 20 nm red particles in the filtrate. Both particles are polystyrene, carboxylate coated, 2 mg/mL initial concentrations.
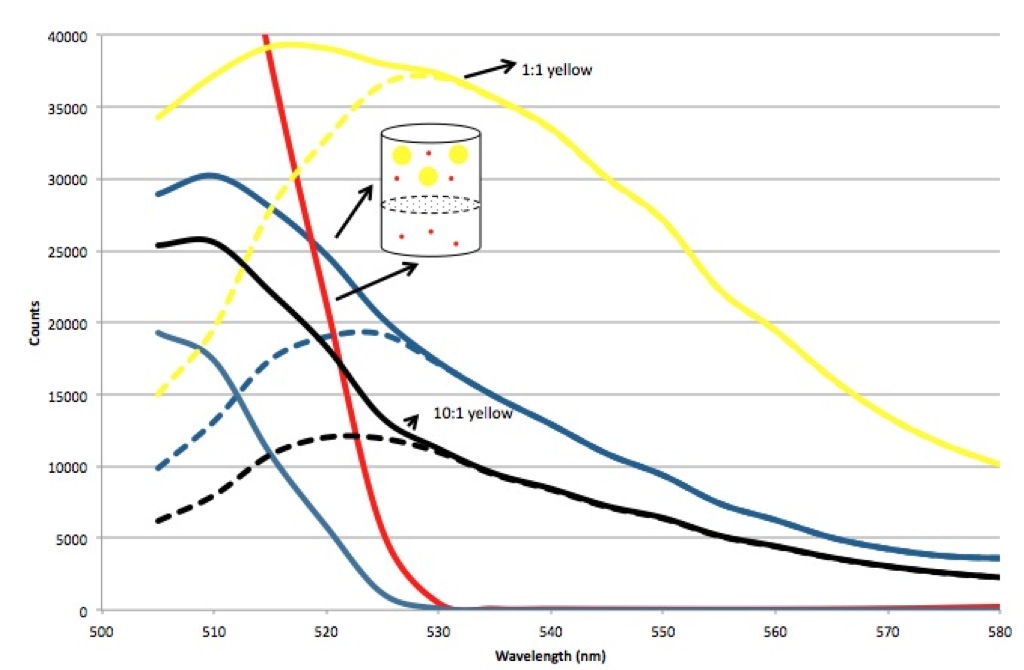
Below is a plot showing two different sets of Em scans using the two Ex wavelengths 505 and 580 nm. All dashed lines are data where the counts received from a water sample have been subtracted, hopefully correcting for light measured from the Excitation wavelength.
It looks like we see a peak in the yellow and red for the initial mixture, but only a peak in the red for the filtrate. So I’d call it a successful separation. That said, this data is not as concrete as I was hoping for. Any suggestions on reducing the signal from the Excitation pulse?
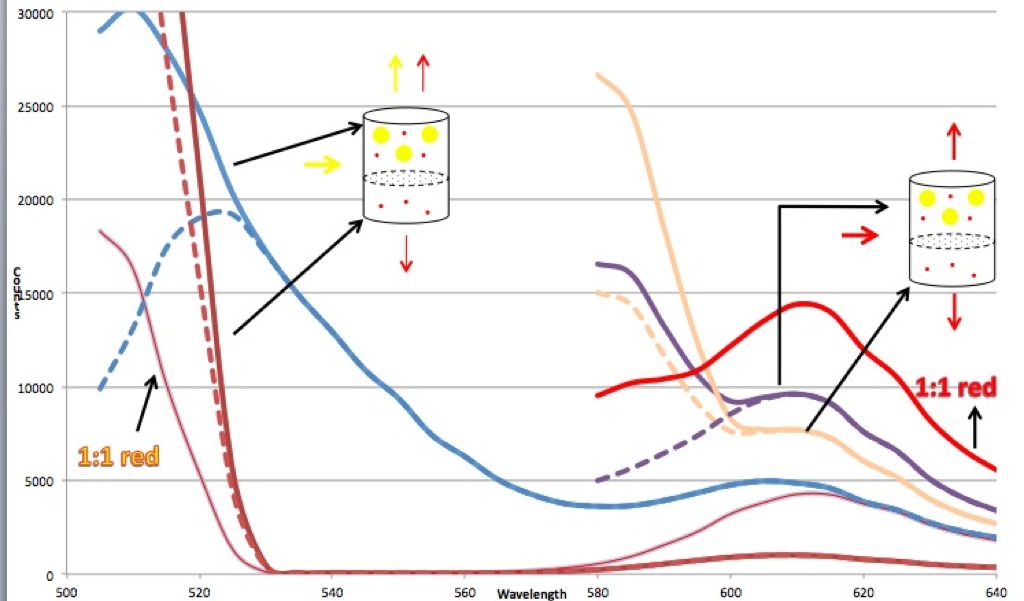
The following plot includes the fluorescence from the mixture and that of the yellow 500 nm particles. The height of the peak falls in between a 1:1 and a 10:1 dilution, as we would expect with the 4:1 dilution of the mixture.