Fouling Mechanism in Josh’s 20 nm, 100 nm SepCon data
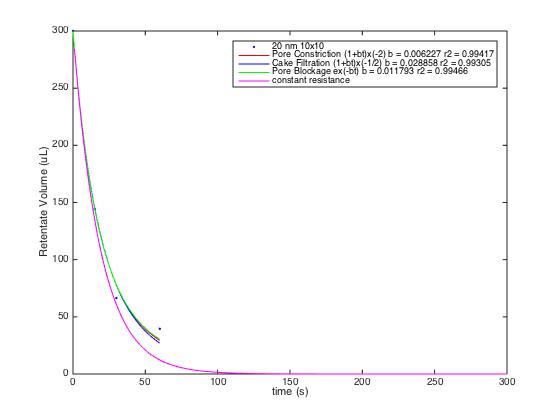
These fits are done using the math outlined in this previous post. We assume an average pore size of 50 nm and an approximate number of pores in the membrane of 1E9.
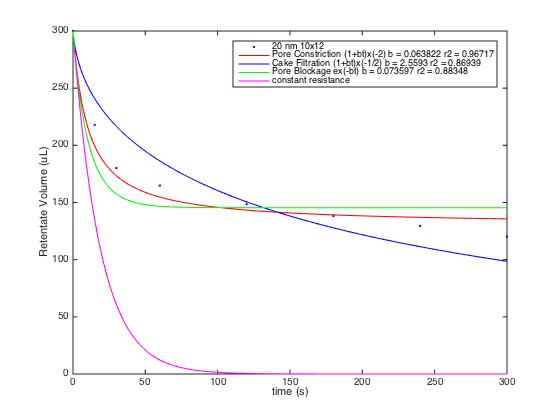
20 nm particles:


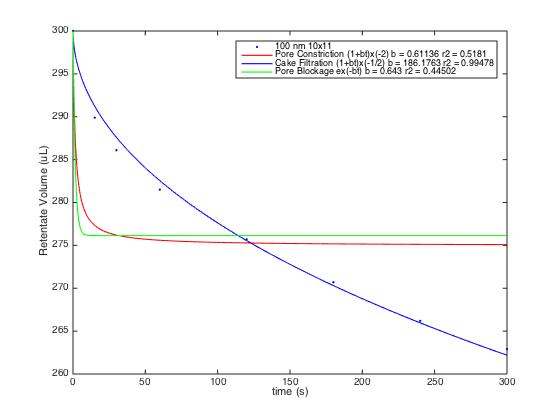
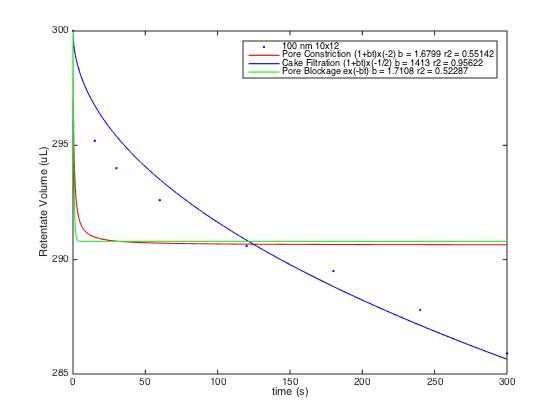
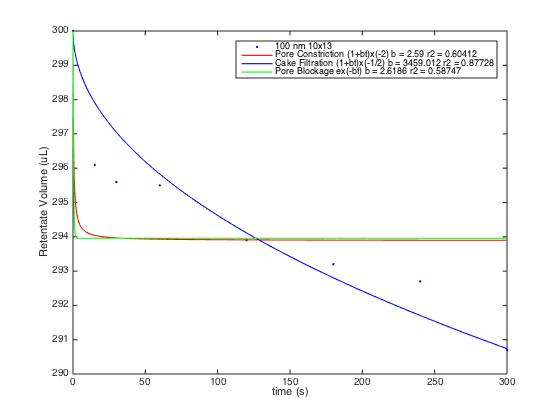
100 nm particles:


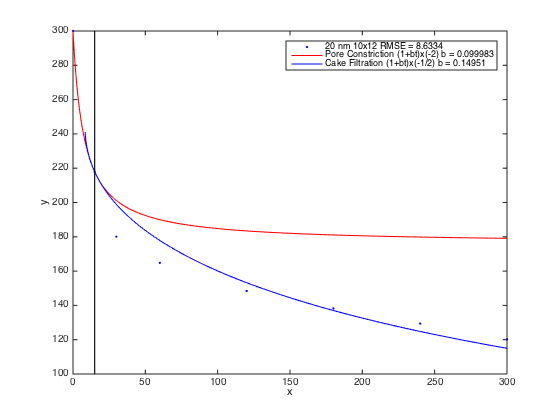
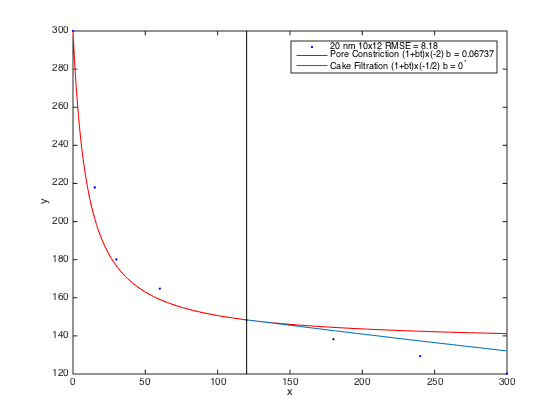
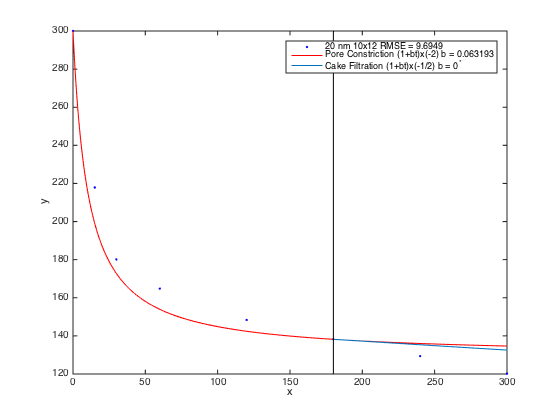
Next, we were curious whether we could show the transition happen from pore constriction to cake filtration in the 20 nm 10^12 case:
Fixing the transition at 15 seconds:
30 seconds:
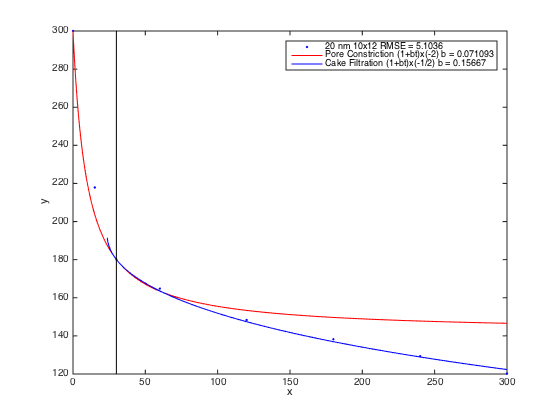
60 seconds:
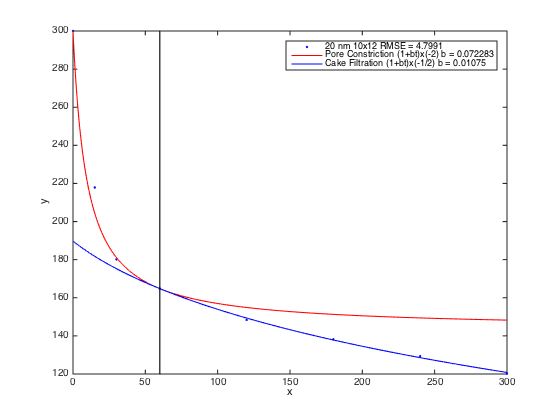
120 seconds:
180 seconds:
The set of symbols on the first graph is assigned differently than the rest. Can you please fix and post fits for 20 nm pores ASAP.
Done. Also, I updated the 100 nm particle fits to reflect a newly calculated initial resistance of the membrane.
This is getting really good! You should be able to plot ‘no clogging’ curves too. I’m wondering if the decay for the low concentration 20 nm particles is just the decay we expect from the loss of pressure.
Updated again. The new curves look pretty good.
One more round … I think the early effects are pore blocking (100 nm) or pore restriction (20 nm) and the long term effects are due to cake build up. Any way you can build a model that switches between the two in a continuous way. This would allow you to say when (roughly) the transition occurred.