HD device Pressure Test set-up and baseline measurements
In order to investigate the breakage of nanoporous nitride hemodialysis chips during rat dialysis, we are investigating the pressures in the system. We will investigate normal operating pressures as well as potential impulse pressures from handling or valve operation. To get a base line, four LabSmith pressure sensors were aded to a setup which mimics the rat dialysis. We measure pressure on the ‘blood’ side and the ‘dialysate’ side at both the inlet and outlets of the dialyzer. The expected pressure drop across the various fluidic resistances was calculated using either the formula for circular pipes
![]()
for the tubing between the sensor and the first silicon gasket flow channel , or for low profile rectangular channels.
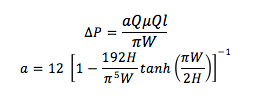
which includes the gasket channels and the membrane channels themselves. The majority of the pressure drop is across the membrane itself due to its lower height of 300 µm. The dialysate side doesn’t drop as much pressure as the ‘plenum’ on the flat side is both wider and deeper. The set up looks a little bit like the kludgy image below with the four sensors as close to the dialyzer as possible. The Tees are connected to either the peristaltic pump on the blood side, or the gravity fed IV bag on the dialysate side. The dialyzer used one real dialysis chip and one mock chip (a chip frame blocked with a silicon gasket) in order to minimize the number of chips used. Water was used in these baseline experiments for ease and later work will be done with serum on the blood side. I will be making a single chip device to make the experiment ‘cleaner’.

Testing reveals that the calculations used were spot on, at least within measurement error. I will provide a chart of the pressure and pressure drops across the membrane soon. I left the data at home!
The data does show a smaller pressure drop across the dialysate side and a higher presser altogether on the blood side, leading to ultrafiltration. The drop across the membrane on the blood side (using water) was around 0.1 psi (this varied as I used a few different flow rates near 0.5 mL/min)
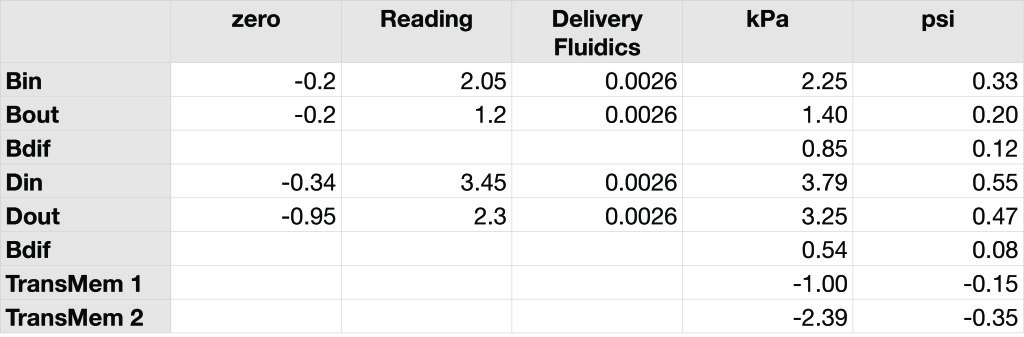
The first column is the reading with the fluidics disconnected, zero. The second column is the actual reading in kPa. The middle column accounts for the pressure lost in the fluidics between the transducers and the membrane. The penultimate column is teh pressures of interest in kPa. Going down the last column shows the pressures, in psi, of the Blood side in and out (Bin, Bout), the pressure lost along the blood side (Bdiff), then the Dialysate side in and out (Din, Dout), and the pressure dropped along the membrane (Ddiff). The last two are the transmembrane pressure at the blood side inlet (TransMem 1) and at the blood outlet (TransMem 2). In this set up, the Dialysate side is high due to the height at which the dialysate bag was hung, the long tubing at the end before it gets back to atmosphere, and the flow rate, all of which were set arbitrarily. The higher pressure of the dialysate side explains the negative transmembrane pressure which in this case would add water to the blood instead of removing it.
The setup is unlike the animal model in that in place of in vivo blood supply and return points, we are here using an open beaker which provides no additional pressure. I will need to construct a mini-vascular test bed to supply both arterial and venous pressures to more closely mimic the animal model experiments.
I investigated the pumps stall pressure by clamping the blood return line, the maximum pressure achieved was 1.28 psi at the pump rate used in the animal work.