MANUSCRIPT REVISION: Membrane pore spacing can modulate endothelial cell-substrate and cell-cell interactions
Membrane pore spacing can modulate endothelial cell- substrate and cell-cell interactions (REVISION)
We submitted our “focal adhesions” paper to ACS Biomaterials Science and Engineering late last year. We received reasonable reviewer requests from three reviewers.
I think I am mostly finished with revising the figures. Here are the updated figures and my comments on what changed.
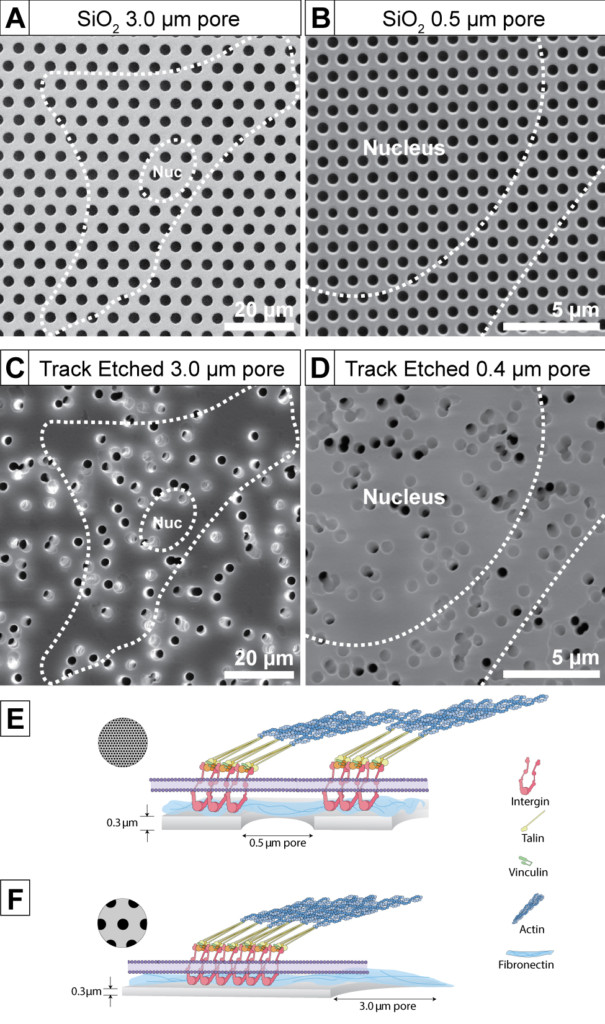
I revised Figure 1 to include SEM of track-etched membranes (thanks to Aslan) because we discussed it at the end of the paper and one of the reviewers asked why our data couldn’t easily be extended to TE membranes. I tried to explain the issues with TE membranes in the original submission (doublets, irregular pore spacing, etc.), but I think a picture is truly worth 1000 words in this case. I made sure to scale and crop images so that length scales matched between pairs of images. I also oriented the images so they match our schematic in Figure 5. I made the alignment slightly off on purpose to make sure people understand that the top row are real images of SiO2 membranes and not just schematics. If you ever wondered if I am truly anal retentive about figures – now you know.
(a) 3.0 um SiO2, (b) 0.5 um SiO2, (c) 3.0 um high porosity TE Greiner, (d) 0.5 um high porosity TE Greiner
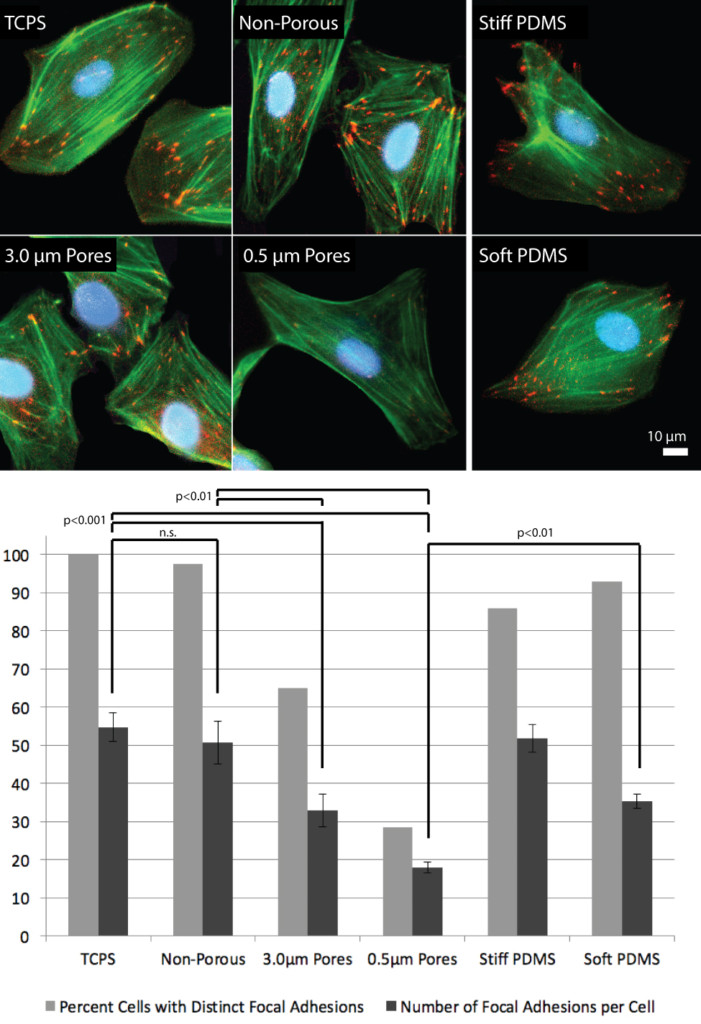
For Figure 2, I still need to make one minor tweak to the significance bars. I will add small horizontal bars showing that we are grouping the light and dark bars. One of the reviewers was confused.
There were requests for images of Fibronectin Fibrillogenesis and ZO-1 staining on non-porous SiO2 as opposed to TCPS, so we swapped out the TCPS images. I made a supplemental figure (down below) that shows non-porous SiO2 and TCPS are qualitatively identical. We see strong FN on non-porous, but weak ZO-1 as expected.
One or two reviewers asked us to quantify fibronectin fibrillogenesis. Henry did this for the SiO2 membranes (background is high on PDMS). Luckily his measurements match our qualitative claims that the fibrils are less distinct on porous membranes compared to non-porous SiO2. We hypothesize this is the result of lower tension within cells on porous substrates due to their lower FA count. This matches some reports in the literature that cells produce less fibronectin on soft substrates. New Figure 3:

ZO-1 is now it’s own figure. It lacks quantification – I’m hoping we don’t get dinged.

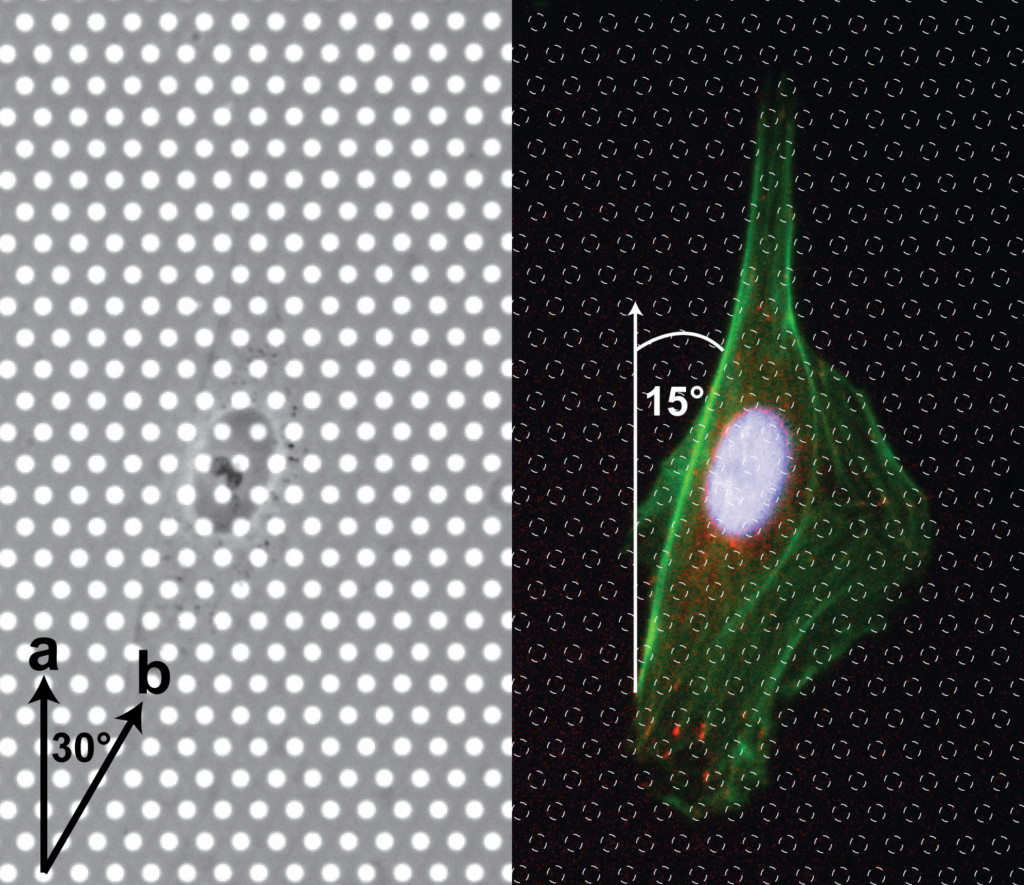
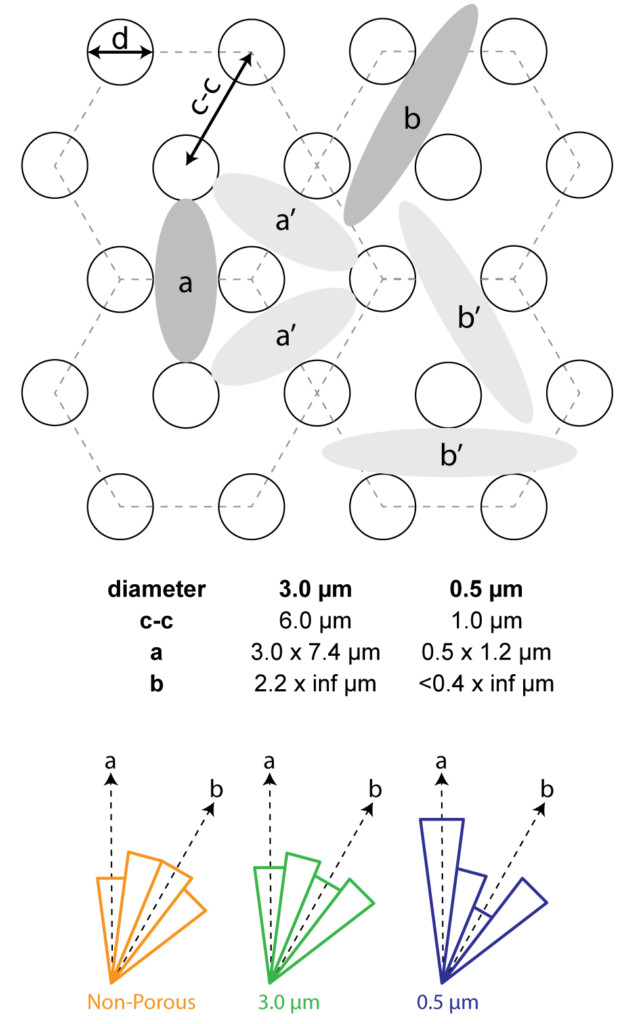
We had a couple of requests to further investigate alignment because we only considered ‘a’ or ‘b’ alignment. I broke down the comparisons to every 15 degrees (as opposed to 30 degrees in the first submission). We are now looking at ‘a’, between ‘a’ and ‘b, ‘b’ and between ‘b’ and ‘a’. We see similar results to our original analysis and therefore do not need to alter our conclusions. Cells do not seem to have an orientation preference on non-porous or 3.0 um pores , but do prefer the ‘a’ orientation on 0.5 um pore membranes. They actually seem to dislike the ‘b’ orientation on 0.5 um pore membranes. New Figure 5:
Supplemental Figures.
Figure S1 is unchanged:

Figure S2 is unchanged:
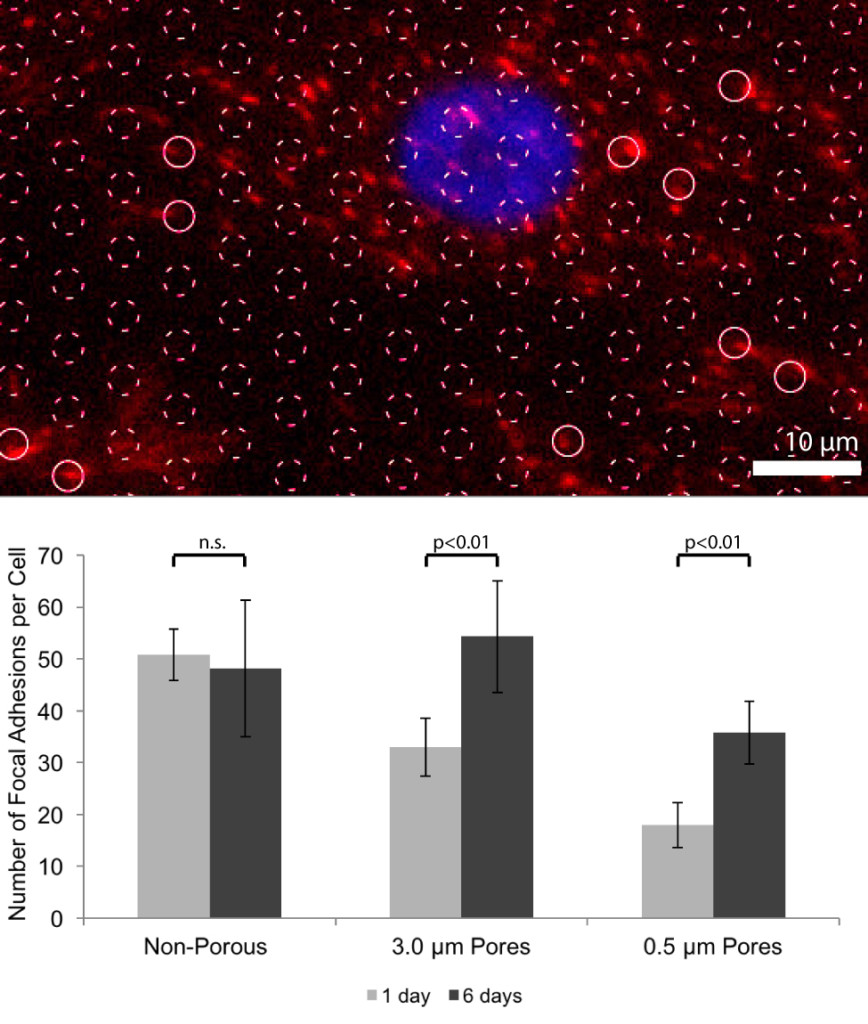
Figure S3 is NEW. This shows cells behave similarly on TCPS and non-porous SiO2.

Figure S4 is NEW. This figure will be used to explain how we measured alignment and to show that FAs do not form over pores at 24 hours.