HUVEC migration and Fibronectin Fibrillogenesis
Intro:
Hi all, as we investigate the formation of HUVEC focal adhesions on porous SiO2 membrane , we also looked at fibronectin fibriollogenesis.
Interestingly, it appears that after 24 hr (since the initial seeding), the fibronectin fibrils formed by HUVEC vary depending on the pore characteristics of the SiO2 membrane. In this case, we looked at nonporous (NP), high porosity 0.5 μm, and high porosity 3 μm. High porosity refers to a center-to-center distance of just two pore diameters.
The figure below illustrates the distinction between the 0.5 μm and the 3 μm pores.

image courtesy: The Gaborski Lab
Fibronectin Labeling Protocol:
3.7% paraformaldehyde (15 min), 40 mg/mL BSA (15 min), 5 μg/mL of AF488 anti-human fibronectin (1 hr), with PBS wash in between each step. NOTE: AF488 anti-human fibronectin is from eBioscience (cat No. 53-9869-80).
Results:
A quick glance revealed that qualitatively, the fibronectin fibrils tend to be more pronounced (brighter) and longer in length on the nonporous and 3 μm SiO2 membrane.

Attempting to characterize the fibronectin fibrils more quantitatively, we performed the following analysis:
Fibronectin Intensity
For each 10X image of fibronectin tracks, five 100 μm x 100 μm regions were randomly selected from regions with cells and a 50 μm x 50 μm region was arbitrary chosen from a region without cells as background. The average intensity of each selected region was background subtracted and pooled together to produce a sample size of at least fifteen for each substrate type (from 3 or 4 independent substrate samples).
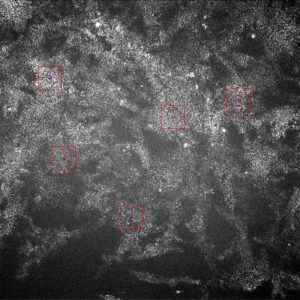
Below is a representative image (10X) of the fibronectin intensity analysis:
Fibronectin Fibril Length
For each 40X image of fibronectin tracks, the edges of the fibronectin fibers were detected using the Laplacian of Gaussian method using the MATLAB function “edge”. Describe briefly, the 2nd spatial derivative of image intensity was calculated and the edge was defined at wherever there is a zero-crossing. The half perimeter of the edge was used as the approximation of fiber length. We only include long fibers (>= 5 μm, from 3 or 4 independent substrate samples) in the analysis since the large number of short fibers presents a noisy statistical background.
Below is a representative image (40X) of the fibril length analysis:

Statistical Comparisons

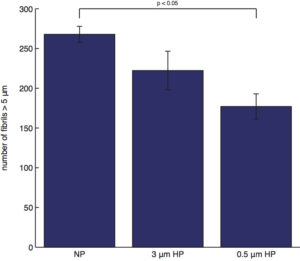
Tukey’s HSD post hoc tests (α = 0.05) were used for all pairwise statistical comparisons. As expected, the intensity of fibronectin fibrils on NP, 3 μm, and 0.5 μm SiO2 membrane all different from each other. While the fibril lengths seem to be higher on NP and 3 μm SiO2 membrane, statistically significant difference is only seen between the NP and 0.5 μm SiO2 membrane.
Interpretation and Future Direction
The 0.5 μm SiO2 membrane seems to hinder HUVEC’s initiation of fibronectin fibrillogenesis. This is possibly due in part to the lack of a continuous stretch of surface for fibronectin deposition. However, similar effects were also seen for HUVECs seeded on soft substrate [1 ,2] where there are no surface disruption. Thus a more complicated cell-substrate interaction/mechanotranduction may be at work behind the scene. Currently we are investigating the relationship between HUVEC migration and fibronectin fibrillogenesis. We hypothesize that the quantity and the length of fibronectin fibers are proportional to the duration at which the HUVEC spent at a location, and thus inversely proportional to cell speed.
References
- Eisenberg, Jessica L., Asmahan Safi, Xiaoding Wei, Horacio D. Espinosa, GR Scott Budinger, Desire Takawira, Susan B. Hopkinson, and Jonathan CR Jones. “Substrate stiffness regulates extracellular matrix deposition by alveolar epithelial cells.” Research and reports in biology 2011, no. 2 (2011): 1.
- Palchesko, Rachelle N., Kira L. Lathrop, James L. Funderburgh, and Adam W. Feinberg. “In vitro expansion of corneal endothelial cells on biomimetic substrates.” Scientific reports 5 (2015).