Tangential Flow Filtration of Gold Nanoparticles: A Model Exosome System
This is the second in my series of posts that will be on my model exosome system. As I am trying to define the appropriate conditions for separating exosomes from blood and other fluids, I am first going through and trying to isolate each important parameter and see how they affect the capture of these nanoparticles. In an attempt to explore the effects of pore geometry on capture, I have been using gold nanoparticles in the size range of the pores to try and capture them in both dead end filtration and tangential flow filtration. However, when I did my previous dead end experiment (see my last post), there were large aggregations of gold all over the surface of the membranes. This was due to me using PBS as the suspension buffer, which caused the nanoparticles to aggregate, immediately invalidating the results of that experiment. While I did see individual particles lodged in the pores, this experiment has to be repeated with gold in water to make the results valid.
In my tangential flow experiment that I conducted, I used flow chips from wafer 1228 (50 nm pores, 100 nm thick membrane, 13% porosity) and I selected 50 nm gold nanoparticles to capture. I figured that these were in the size range of the pores, so I would be able to capture the majority of the particles. However, as we can see in Fig. 1, even though these pores are specified around 50 nm, the majority of the completely through pores are significantly larger. The smaller pores actually appear to the the bowl with hole style pores, which was not intentional, but may in fact prove the point that we were trying to make.
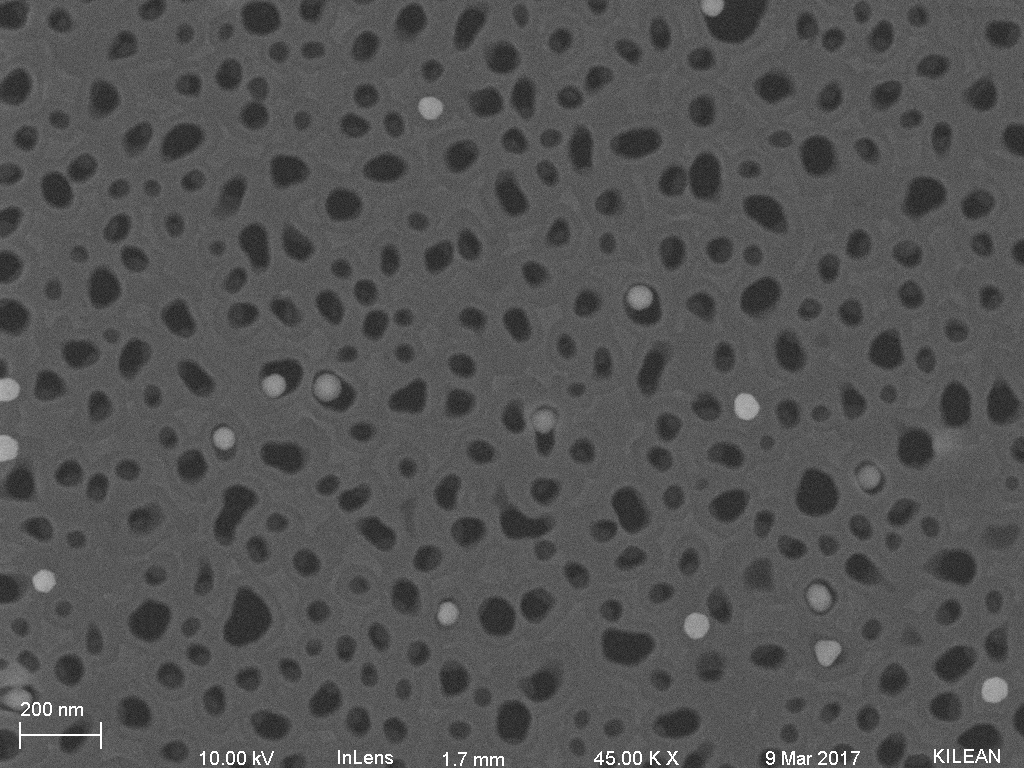
Figure 1: Gold nanoparticles (d = 60 nm) lodged in pores on the flow membrane. Note how though the contrast is a bit off, the pores appear to not be completely through the membrane.
In trying to replicate my experiments from last year, I was once again using the two pump system, to try and ensure that I would have a transmembrane pressure being applied quite constantly on the nanoparticles. However, I wasn’t noticing much liquid being drawn through the membrane, even though I was pulling at what should have been 4 μL/min. I thought that this might just be due to the fluid being contained in the syringe hub and didn’t think too much of it. When I went back to look at the pump before lending it to somebody for the weekend, I noticed something that I should have payed attention to. The syringe diameter setting had been changed and was set for a 9 mm diameter syringe. I use the BD 1 mL syringes, which have a diameter of 4.78 mm. This would affect the pumping quite significantly, as the pump would go much slower with the smaller syringe, meaning that less fluid was being pulled through the membrane. This means that I was only generating a small amount of transmembrane pressure through the membrane, which may actually explain why not all the pores are occupied.
(Update) Going back and calculating the volumetric flow rate that was being pulled through the membrane, we can calculate the linear velocity for a 4 μL/min flow rate flow rate through 9 mm syringe, and get a 4 μm/min linear velocity. Translating this to a 1 ml syringe, which has a diameter of 4.78 mm, we can plug in the linear velocity being applied by the pump, and we get that the actual volumetric flow rate is 1.13 μL/min. This means we were generating approximately a quarter of the flow I hypothesized. Therefore, the transmembrane pressure would be reduced by a factor of 4.
Even though the pumping scheme was different that what I had wanted it to be, I still achieved very significant results. As we can see in Fig. 2, nanoparticles were lodged in the pores like we expected them to be. Additionally, it was approximately 1 nanoparticle per pore, which is what we want, with the larger pores sometimes containing 2-3 nanoparticles. The pores that appeared to have the bowl with hole morphology could capture nanoparticles that were smaller than the widest diameter of the pore, but would retain the particle because it was smaller than the inner pore diameter.
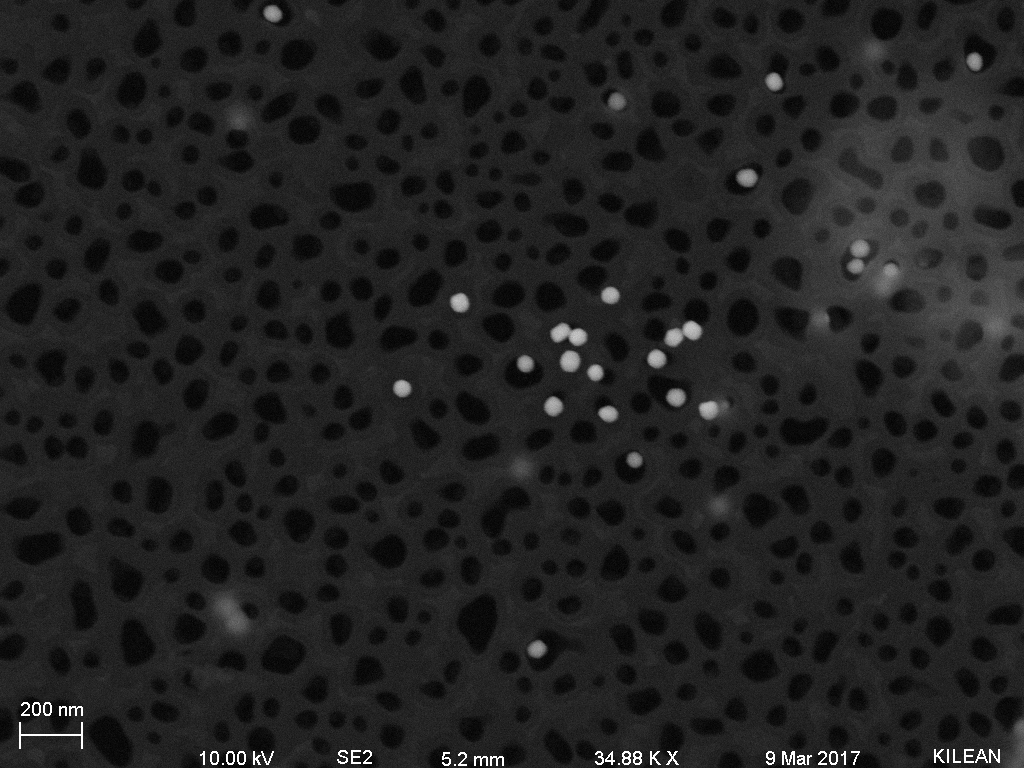
Figure 2: Micrograph of gold nanoparticles lodged in pores.
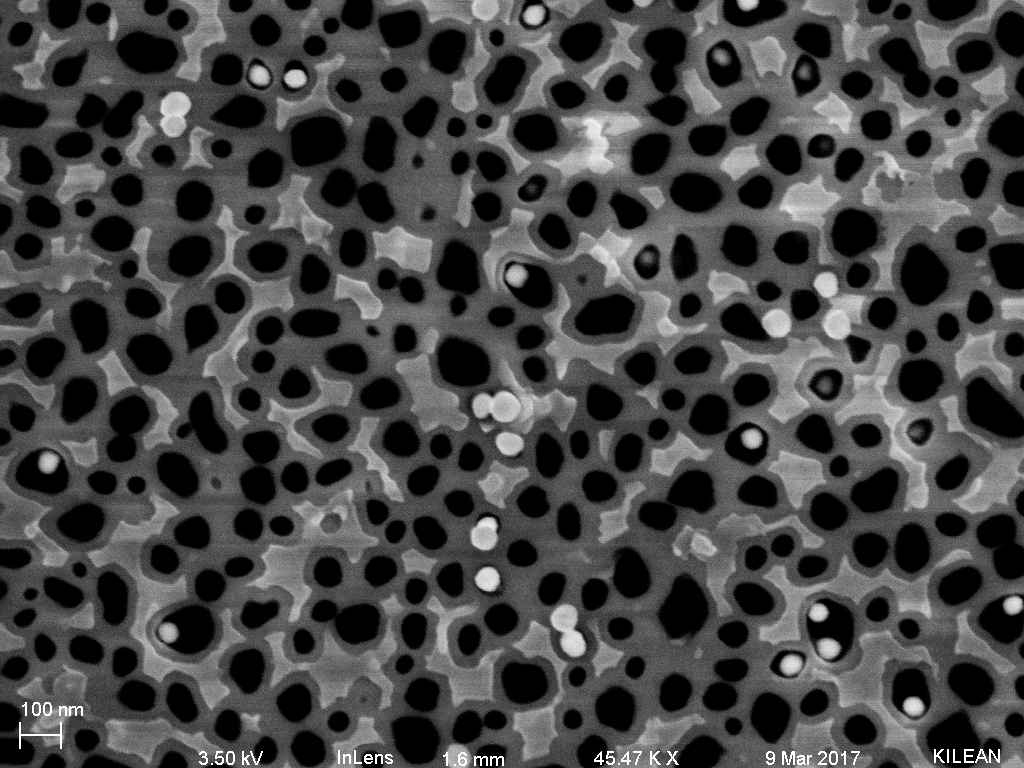
Figure 3: Lower voltage generated a higher contrast image of the nanoparticles in the pores. While we lose the depth of imaging, we can see the nanoparticles better.
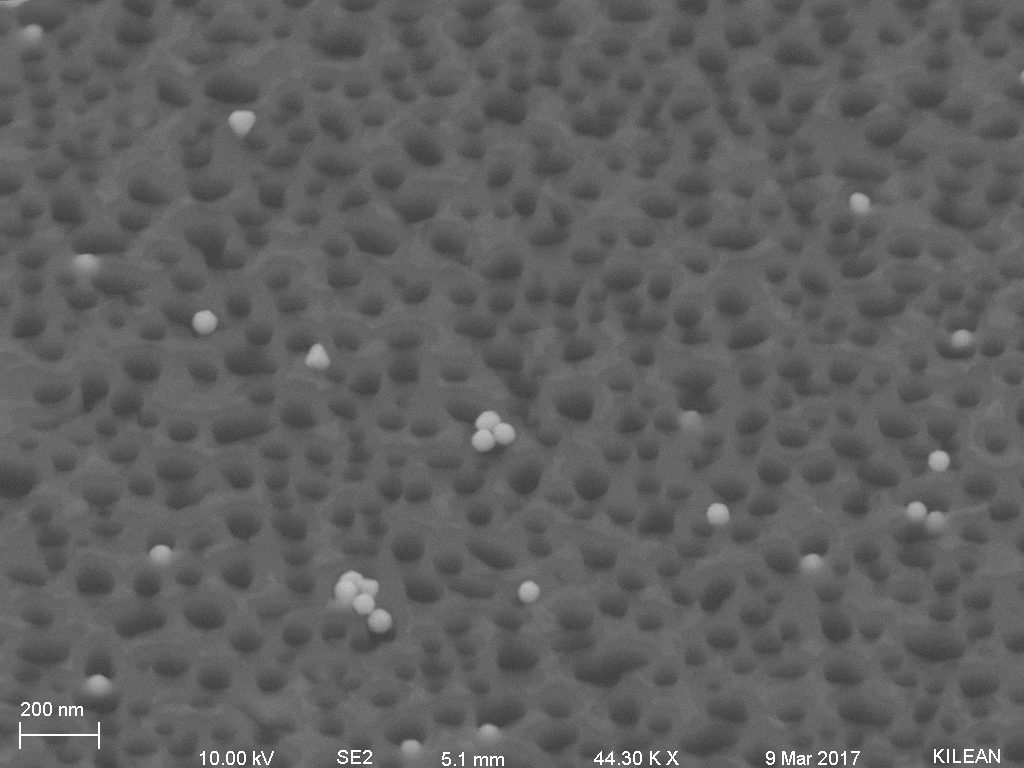
Figure 4: Image taken at a 54° tilt. In this image, we can see particles are actually lodged in the pores, showing quite efficient capture.
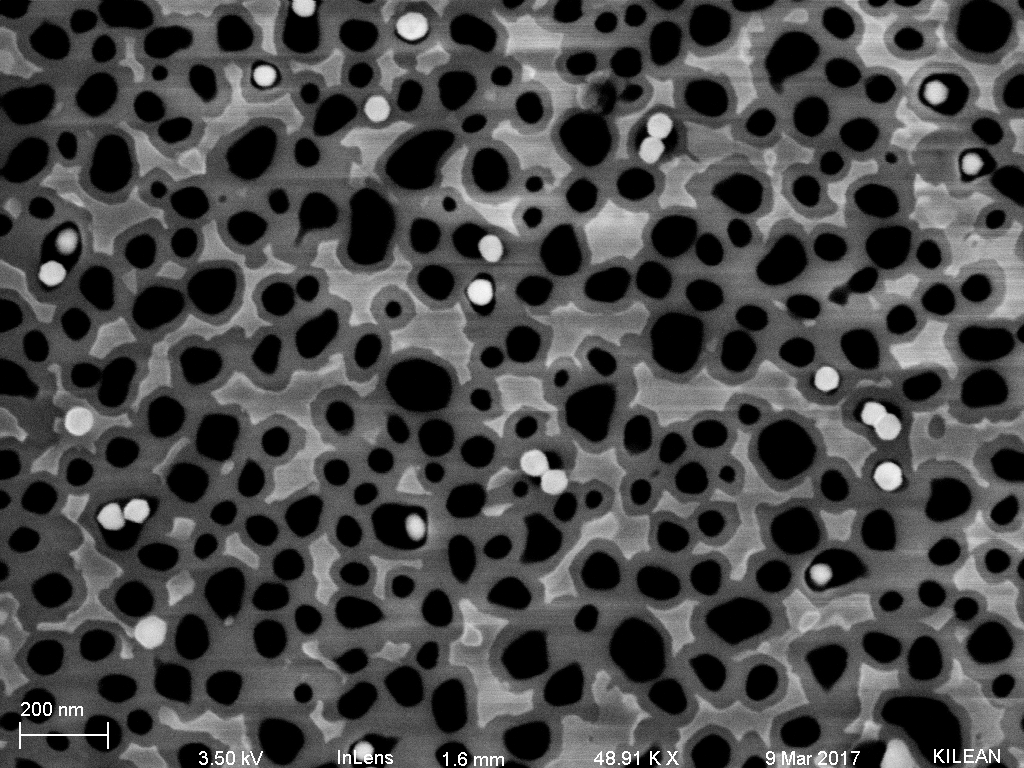
Figure 5: Low voltage SEM of gold in the pores.
These results are quite good, indicating that our theory about capture is correct and that we should be able to produce the same results very consistently. Going forward, I will be repeating this experiment to confirm that the results are not a one off thing and the I can effectively reproduce these images. I will run the system at the same conditions and then again with the adjusted pumping to show that both techniques should work for capture. I will also repeat the dead end experiment, to show that we should be able to lodge purified exosomes using that system. After those experiments, I will get a purified exosome sample from Dr. Carla Beckham, a urologist at URMC, and then repeat the experiment to show that I can capture exosomes quite consistently using this method. Finally, I will then develop a set of experiments to determine all the correct conditions at which capture occurs.
Please calculate what the flow rate was through the bottom chamber based on the tube diameter. Update the post with that information. We need to repeat with everything dialed in as we want.