Track Etched and NPN Experiments Comparison
Hello Everyone,
As you probably know, i have been working on calibration curves for NPN and TE membranes and comparison of these two sets of experiments with each other. This post is all about how i made the calibration curves and how the comparison of TE and NPN experiments would look like.
Plotting Calibration Curve process:
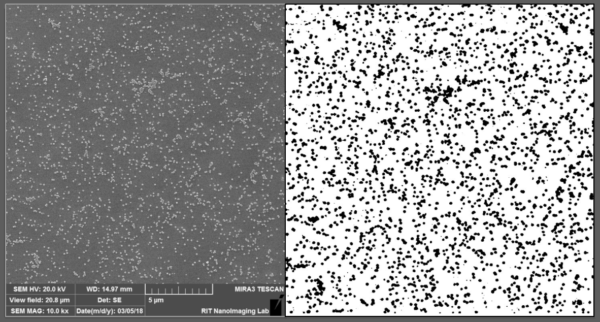
Different dilutions of 100nm beads were dried on the surface of the both NPN and TE membrane which were heated up to 85 C to minimize the coffee ring effect. Then, the membranes were placed in the same devices as actual experiments and the channels were filled with DI water and the intensity of different regions of interest were measured. The regions of interest were marked and later exact same region was imaged by SEM. SEM images were then analyzed by ImageJ to calculate the number of particles. Briefly, after binarizing the image and putting the proper threshold, first the intensity of 5 different single beads were measured and then averaged. After that the intensity of the whole image was measured. Number of beads in each image was calculated by dividing the total intensity by the average intensity of a single bead. The values were normalized to 1 mm2 of the membrane for both the intensity and the concentration of particles.
- Track Etched Membranes:
For TE calibration curve, almost 30 different regions of interest were studied (Both fluorescent intensity and concentration of particles), The fluorescent intensity was divided into 8 regions and values in each region were averaged for both fluorescent intensity and the concentration of particles leading to 8 data point to plot the calibration curve. 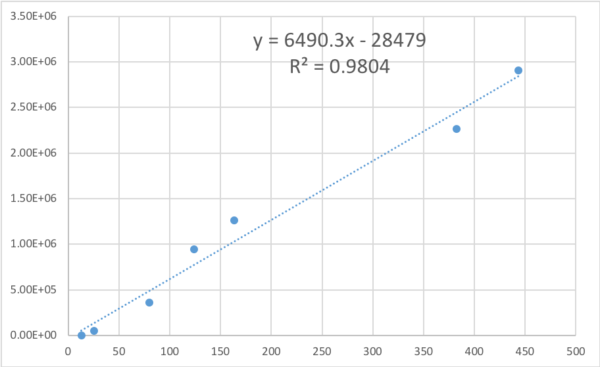
2. NPN Membranes:
For NPN experiments, particle droplets were dried on NPN membranes and almost 20 different regions of interest were studied and the values were categorized into 6 regions and were averaged for both fluorescent intensity and concentration of particles leading to 6 data point to plot the standard curve.

Based on the best linear fit equation, intensity values from 3 different experiments for both NPN and TE were correlated to the number of particles and the result can be seen in the table below.
Full table: Comparison of NPN and TE experiments
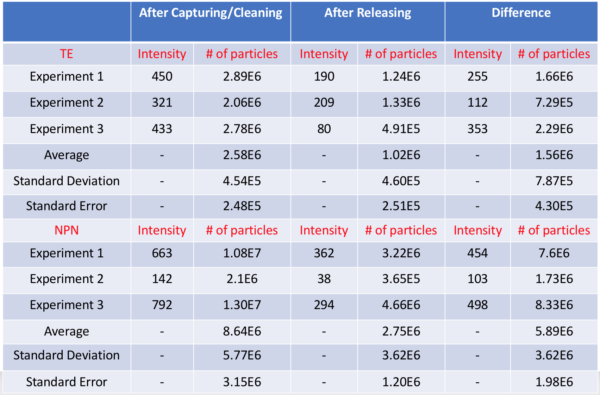
Summary table: Comparison of NPN and TE experiments:

These are my thoughts and points about these results:
- In NPN experiments, we have one data point which is off from 2 other data points resulted to a huge standard error. I have been trying to repeat this experiment but haven’t been successful yet.
- The results show that under same experiment condition of pushing with 5 microliter/min and pulling with 2 microliter/min, We were able to capture more particles (all possibilities together) on NPN compared to TE membranes. This means that non-specific + on pores capturing of NPN is larger that Non-specific + on pores + inside pore channels capturing of TE membranes. The first assumption here is being able to detect the inside pore channel particles. Please note than we have almost 50 times more pores on NPN compared to TE, but the average pore size of the NPN membranes is 50 nanometer while the TE membranes are 80 nm which makes them a better membrane to capture 100 nm particles.
- After releasing result show that using NPN membranes we have more particles that are non-specifically captured compared to the particles that are non-specifically and inside pore channels captured on TE membranes. This can be a good thing, since we don’t have any inside pore channel capturing on NPNs, by treating the surface of the device to minimize the non-specific absorptions, we will be able to increase the efficiency of our system.
- The difference result show almost 3 times better efficiency of NPN over TE membranes which means we are able to capture and release more particles using NPN membranes compared to TE membranes.
Please do the back flow experiments at 100 or 200 ul/min. NPN can handle it.
Sure. I will do that. Thanks